
Does Stocks’ Fast Start Bode Well For Another Good Year?
The U.S. stock market is off to a fast start again in 2018; historically, this has been a portent of further gains every time.
We typically get queasy when it comes to event-specific seasonality-type studies. Don’t get us wrong, when it comes to systematic trading strategies, few have the statistical chops to beat tried and true approaches based upon long-term seasonality tendencies. However, when it comes to seasonality studies based upon a specific development occurring in the market at the time, we are usually uncomfortable when it comes to extrapolating the event it for forecasting purposes. The reason is mainly because it is difficult to rationalize the reasons behind such forecasts.
Sometimes we come across a study, though, with compelling enough history to be intriguing. That is the case with today’s Chart Of The Day. As is typical for the beginning of a year, there has been an abundance of seasonality-based charts and research posted on social media of late — particularly due to stocks’ fast start (again). Ryan Detrick is one consistent purveyor of such studies (@RyanDetrick on Twitter). He has had some interesting stats pertaining to the stock market’s strong start in 2018 that piqued our interest. In particular, he demonstrated a unanimous tendency for the stock market to register gains for the full year following the 15 years in which the S&P 500 (SPX) gained at least 2% over the first 5 days of a year (as it has done this year). We took a peek and, indeed, found the same results.
We then took it one step further and looked at all years in which the SPX gained over 1.1% over the first week of the year (yes, data-mining is involved here). Looking back to the index’s start in 1950, there have been 23 years prior to 2018 that saw the SPX accomplish this feat. As it turns out, all 23 finished the full year in positive territory. Rational or not, that is quite compelling.
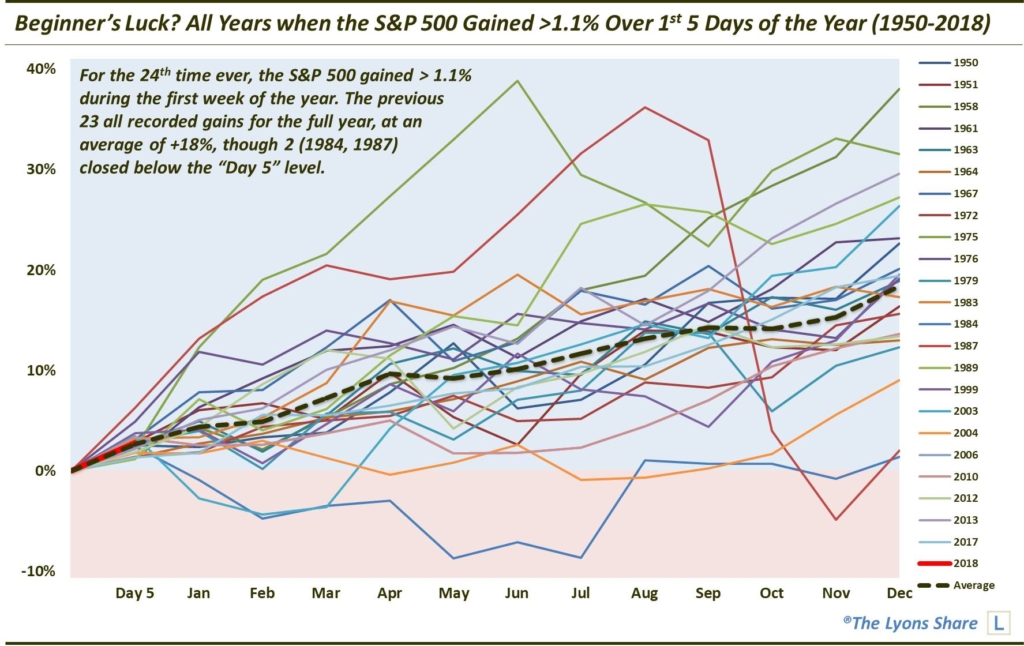
Here are a few of the highlights from the chart/data:
- The average gain during these 23 years was +18.37%
- The average gain from Day 5 until the end of the year was +15.37%
- There were 2 years (1984 & 1987) that closed below the SPX’s Day 5 level
- Just 5 years traded in the negative at any point during the year, with 1984 the only one to dip double digits into the red
- The 3 years that dropped into negative territory immediately after the strong first week continued to struggle for awhile longer (1984 was negative until August, 2003 was negative until April and 2010 was mostly negative until September).
Will 2018 follow the general road map for further gains over the course of the year? We have no idea. The historical statistics strongly suggest it will. However, again, we have a hard time rationalizing why it must be so — and, thus, a hard time applying investment moves based on it. We will simply say that it is potentially a nice tail wind at the back of the bulls…as if they needed another one.
So what WILL direct our investment decisions in 2018? The same basic approaches and philosophies that have done so for the past several decades now. With our “all-access” service, The Lyons Share, you can follow our investment process and posture every day — including insights into what we’re looking to buy and sell and when. Thanks for reading!
_____________
Disclaimer: JLFMI’s actual investment decisions are based on our proprietary models. The conclusions based on the study in this letter may or may not be consistent with JLFMI’s actual investment posture at any given time. Additionally, the commentary provided here is for informational purposes only and should not be taken as a recommendation to invest in any specific securities or according to any specific methodologies. Proper due diligence should be performed before investing in any investment vehicle. There is a risk of loss involved in all investments.


