
Does Big January Mean Another Big Year For Stocks?
Stocks scored big gains for January; historically, this has (almost) invariably been a good sign for the rest of the year.
Unless you’ve been in a cave, you know that January continued the recent absurdly strong (and placid) run in the stock market. Specifically, the S&P 500 (SPX) closed the month higher by 5.62%. Looking at the history of the SPX (you knew we would), this was the 13th January since its 1950 inception that saw the index up as much as 5% during the first month of the year. How did the SPX fare following those prior occasions? Do you sense a chart coming?
The following chart shows the post-January performance through the end of the year for each of the 12 precedents, as well as the average of the years. As you can see, strong January’s have (almost) always brought further gains in the SPX through year-end.
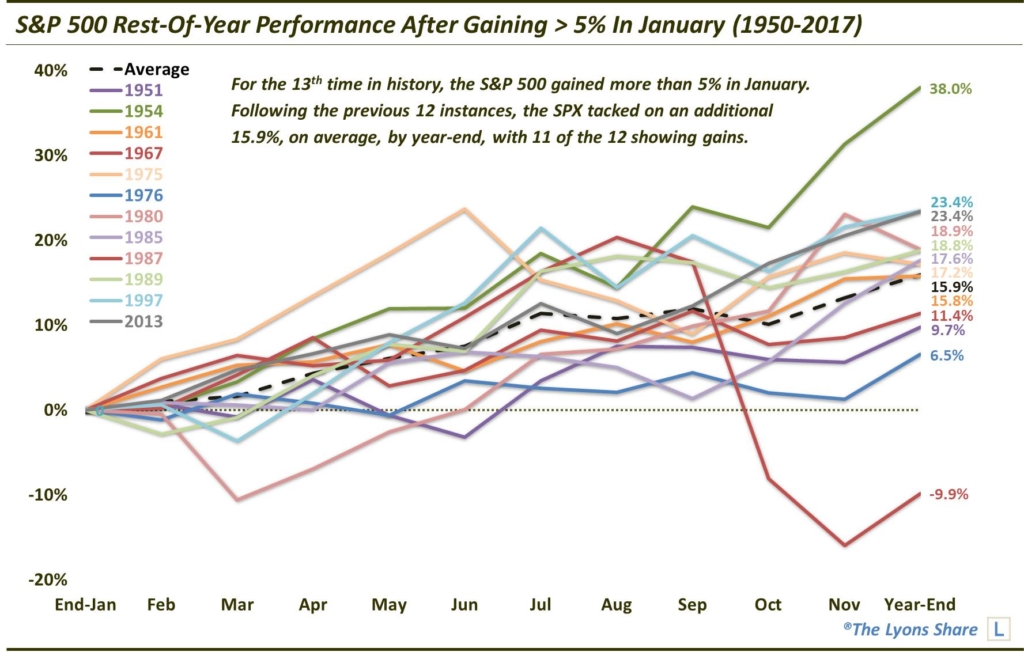
11 of the 12 showed positive returns from the end of January through year-end, at an average of +15.9%. Furthermore, the drawdowns from the January close through the end of the year were minuscule, at a median of -2.3%. Just 3 of the 12 years saw a drop of even 3.9% below January’s closing price at any point during the remainder of the year.
As you might have noticed, the one exception to the positive year-end performance was 1987. Of course, the October crash that year put a hurt on the stock market. The result was a 21% drawdown from its January close (and a 35% drop from its August highs). The January-end to year-end loss ended up being nearly -10%. That said, prior to the crash, the S&P 500 was able to tack on about 23% from its January close into its August high. And 1987 actually had the best return through August of any of the 12 years.
Now, despite this rare phenomenon — and the widely-followed focus on the stock market’s performance during January as it relates to the rest of the year – we are not going to base our investment decisions over the balance of the year based on what occurred this past month. We will instead, as always, monitor market data and our quantitative models as things develop throughout the year. However, given the overwhelmingly positive and consistent performance among the previous occurrences, it does make for a compelling data point. At a minimum, it appears to at least be another gentle breeze at the backs of the bulls.
If you are interested in the Premium version of our charts and research, check out our “all-access” service, The Lyons Share. You can follow our investment process and posture every day — including insights into what we’re looking to buy and sell and when. Thanks for reading!
_____________
Disclaimer: JLFMI’s actual investment decisions are based on our proprietary models. The conclusions based on the study in this letter may or may not be consistent with JLFMI’s actual investment posture at any given time. Additionally, the commentary provided here is for informational purposes only and should not be taken as a recommendation to invest in any specific securities or according to any specific methodologies. Proper due diligence should be performed before investing in any investment vehicle. There is a risk of loss involved in all investments.


