
Correction Road Map – Ver 3.2 (PREMIUM-UNLOCKED)
The following post was originally issued to TLS members on March 2, 2018.
Stock averages are in the midst of the aforementioned likely correction re-test.
Hopefully you have been following along with our “correction road map” on our Daily Strategy Sessions and Weekly Macro Market Reports. To reiterate, corrections such as the most recent episode typically follow a similar template, or road map. The map we have laid out, and continue to update every AM, has been followed by prices to a tee. This post is meant to point out that we may be at an important juncture in the Road Map.
As we highlighted in a Road Map update on February 21, most major averages at the time were
“running into the best cluster of resistance on their respective charts within the confines of the recent correction range.
…A pause at these levels, or a pullback would be unsurprising. Subsequently, a retracement or full-on re-test re-test of the initial correction lows would be the road map norm.
…Look for prices to struggle at current resistance levels. Then, look for a re-test or retracement to levels mentioned.”
Many of those re-test/retracement levels that we mentioned, specifically on our favorite broad market index, the Value Line Geometric Composite (VLG), are now being tested.
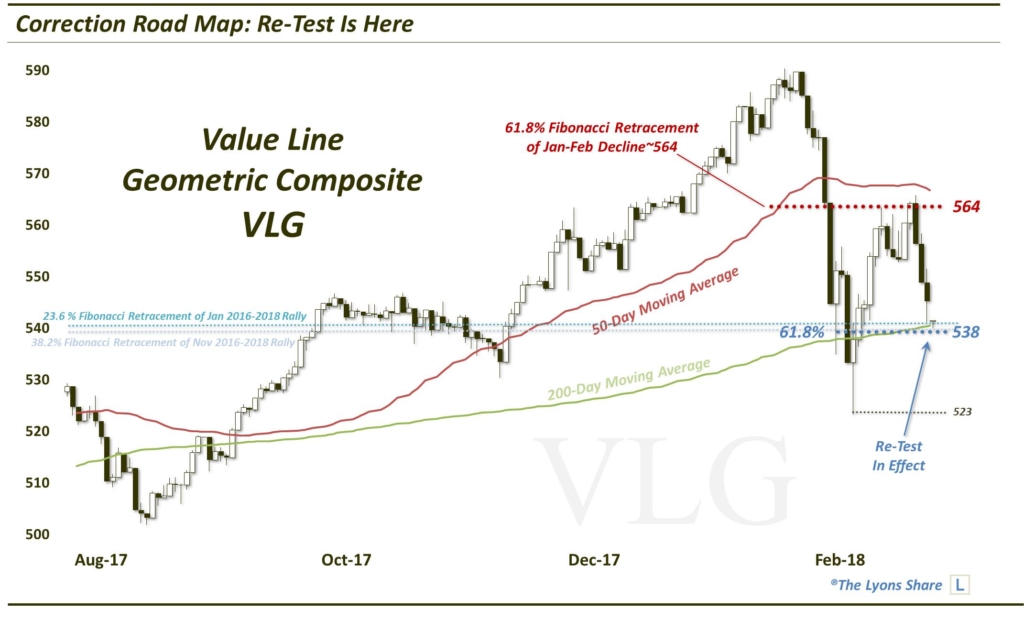
In addition to the initial correction low closes of a couple weeks ago, other potential lines of support near this re-test level on the VLG (~538) include:
- 61.8% Fibonacci Retracement of the post-correction bounce
- 38.2% Fibonacci Retracement of November 2016-2018 Rally
- 23.6% Fibonacci Retracement of January 2016-2018 Rally
- 200-Day Simple Moving Average
While we cannot dismiss the possibility of an overshoot down through this level, or a test of the February 9 intraday low near 523, this present level near 538 should be solid enough to produce a successful re-test low. At a minimum, in our view, it warrants at least the initial campaign of adding back some long exposure that we took off into the post-correction bounce, or even near the late-January highs. Weeks or months down the road, this very well may look like it would have been a very advantageous time to do some buying.
As far as what to buy, we are keeping it to the high relative strength areas that we’ve consistently mentioned on our Daily Strategy Videos, e.g., technology, large-cap growth and pockets of international indices. For specific names and specific support/resistance levels, tune into our Daily Strategy Session Charts Videos, as well as the Weekly Macro Market Report.
_____________
Disclaimer: JLFMI’s actual investment decisions are based on our proprietary models. The conclusions based on the study in this letter may or may not be consistent with JLFMI’s actual investment posture at any given time. Additionally, the commentary provided here is for informational purposes only and should not be taken as a recommendation to invest in any specific securities or according to any specific methodologies. Proper due diligence should be performed before investing in any investment vehicle. There is a risk of loss involved in all investments.


1 Comment