
Hope For Stock Bulls After End Of Winning Streak?
Lengthy streaks of consecutive monthly gains in the stock market have consistently resulted in further gains after the streaks were ended.
If you’re a baseball buff, you most likely know that Joe DiMaggio holds the Major League record consecutive games (56) with a hit. What folks may not know is that after the streak was ended, DiMaggio went on to hit safely in his next 16 straight games. It is in that same resilient vein that we offer stock bulls hope following the end of the Dow Jones Industrial Average’s (DJIA) 10-month winning streak. Let’s take a look.
The DJIA closed the month of February down about 4.3%. Yes, it was a rough month, but it probably felt even worse considering the fact that it hadn’t suffered a down month since last March. That’s 10 consecutive monthly gains for those scoring at home. If you’re not impressed, you probably should be since it was the longest monthly winning streak for the DJIA in over a half a century (1959). It was also just the 5th streak ever, since 1900, of at least 10 straight monthly gains.
But what now? Are the bulls due for a further comeuppance? Not if history is a guide. That’s because looking at all DJIA winning streaks of at least 8 months (there were 7 prior), the index has consistently rebounded immediately after the streak ended. Here are the streak-ending months (and streak length):
- June 1922 (9)
- April 1936 (12)
- April 1943 (11)
- June 1950 (11)
- March 1959 (12)
- June 1961 (8)
- August 1995 (8)
- February 2018 (10)
Today’s Chart Of The Day illustrates the 12-month path embarked upon by the DJIA following the end of these 7 historical streaks.
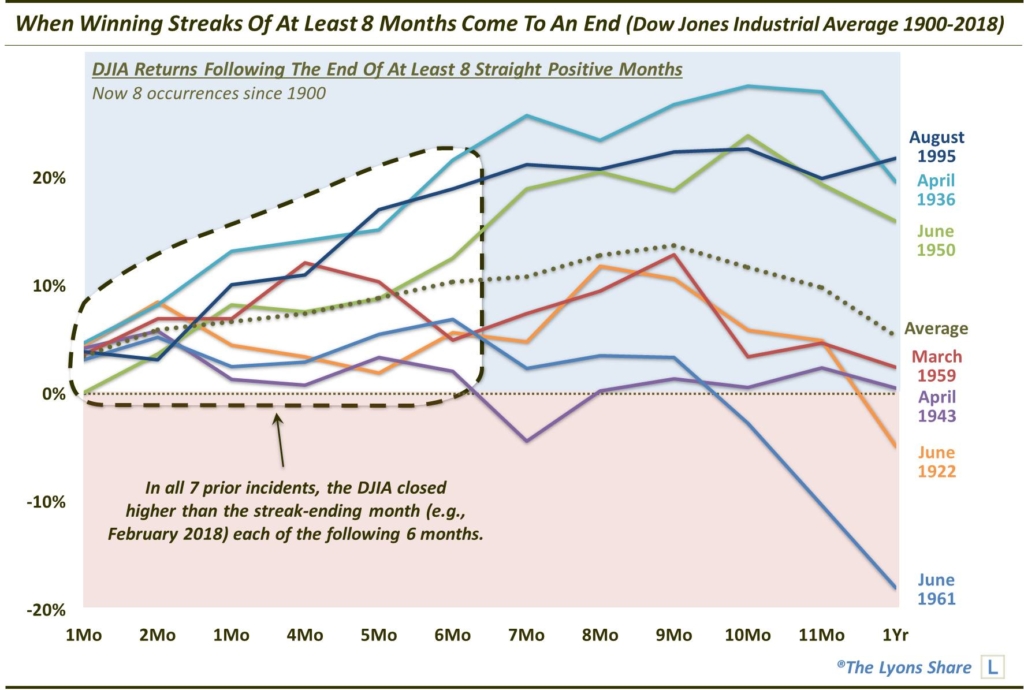
As the chart shows, the DJIA tended to rebound right away. In fact it did so all seven times following the end of the historical streaks. Furthermore, following the end of every one of these streaks, the DJIA closed higher than the streak-ending month every single month from 1 month to 6 months out.
Just 1 incident (April 1943) saw the DJIA close the 7th month lower than the streak-ending month. All occurrences closed months 8 and 9 higher and only June 1961 saw lower closes in month 10 and 11 than the streak-ending month.
I know these types of studies are difficult to put much confidence in in terms of directing investment decisions. That’s probably because we cannot explain them (to the extent that we can explain any market phenomenon). Perhaps the most important takeaway is that, at least historically speaking, the end of the recent monthly winning streak does not have to be a death knell for the bulls. And, in fact, it stands a very good chance to commence streaking once again.
If you’re interested in the “all-access” version of our charts and research, please check out our new site, The Lyons Share. You can follow our investment process and posture every day — including insights into what we’re looking to buy and sell and when. Thanks for reading!
_____________
Disclaimer: JLFMI’s actual investment decisions are based on our proprietary models. The conclusions based on the study in this letter may or may not be consistent with JLFMI’s actual investment posture at any given time. Additionally, the commentary provided here is for informational purposes only and should not be taken as a recommendation to invest in any specific securities or according to any specific methodologies. Proper due diligence should be performed before investing in any investment vehicle. There is a risk of loss involved in all investments.


