Household Stock Exposure Inches Closer To Dotcom Record
The percentage households’ financial assets currently invested in stocks has surged further, now exceeded only by the blow-off portion of the 2000 dotcom bubble.
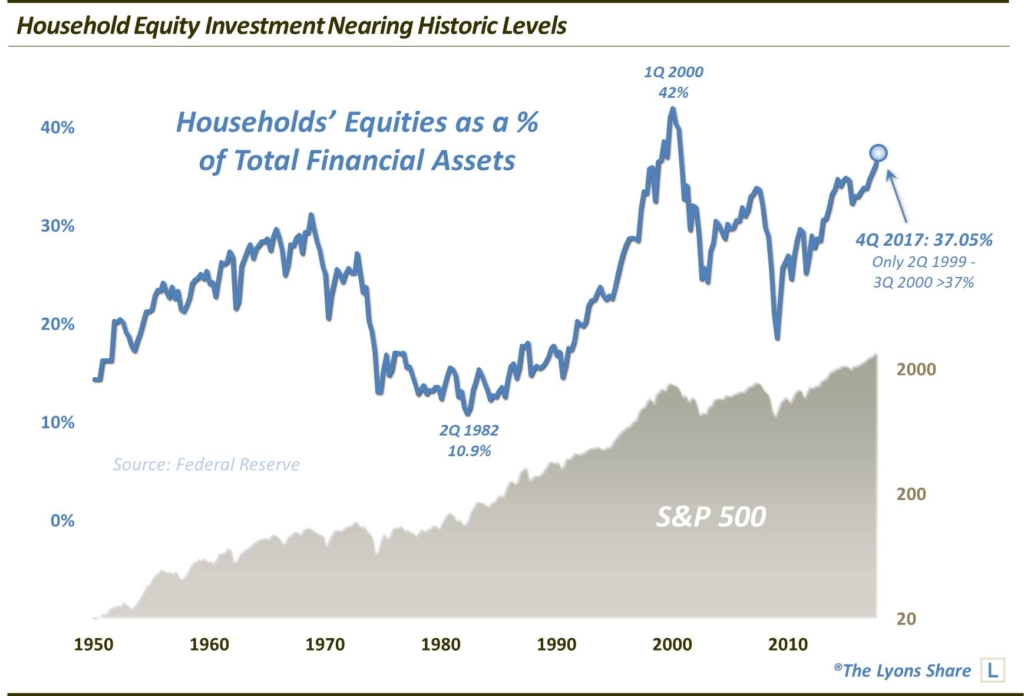
Updating one of our favorite data series from the Federal Reserve’s latest Z.1 Release, we see that in the 4th quarter, household and nonprofit’s stock holdings jumped to 37.05% of their total financial assets. This is the highest percentage since the 3rd quarter of 2000. And, in fact, the only time in the history of the data (since 1945) that saw higher household stock investment than now was during the 2Q 1999 to 3Q 2000 blow-off phase of the dotcom bubble. Perhaps not everyone is in the pool, but it certainly is extremely crowded.

As we’ve discussed many times, this data series is one of our favorite metrics pertaining to the stock market. It is not necessarily an effective timing tool, but is what we call a “background” indicator. It provides an instructive representation of the longer-term backdrop — and potential — of the stock market. It also serves as an interesting lens into investor psychology. As we wrote in a September 2014 post:
“This is one of our favorite data series because it reveals a lot about not only investment levels but investor psychology as well. When investors have had positive recent experiences in the stock market, i.e., a bull market, they have been happy to pour money into stocks. It is consistent with all of the evidence of performance-chasing pointed out by many.
Note how stock investment peaked with major tops in 1966, 1968, 1972, 2000 and 2007. Of course, investment will rise merely with the appreciation of the market; however, we also observe disproportionate jumps in investment levels near tops as well. Note the spikes at the 1968 and 1972 tops and, most egregiously, at the 2000 top.
On the flip side, when investors have bad recent experiences with stocks, it negatively effects investment flows, and in a more profound way than the positive effect. This is consistent with the scientifically proven notion we’ve discussed before that feelings of fear or loss are much stronger than those of greed or gain. Stock investment during he 1966-82 secular bear market provides a good example of this.
After stock investment peaked at 31% in 1968 (by the way, after many of the indexes had topped in 1966 — investors were still buying the dip), it embarked on steady decline over the next 14 years. This, despite the fact the stock market drifted sideways during that time. By the beginning of the secular bull market in 1982, the S&P 500 was right where it was in 1968. However, household stock investment was at an all-time low of 10.9%. If the stock averages drifted sideways, why did stock investment drop by two thirds? The repeated declines over that period left investors scorned and distrustful of the stock market. They never really started putting money back into stocks until 1991.
What is the significance of the current reading? As we mentioned, it is the highest reading since 2000. Considering the markets are at an all-time high, this should not be surprising. In fact, while most of the indexes surpassed their prior peaks in early 2013, household stock investment did not surpass the 2007 highs until the 2nd quarter of this year (2014). The financial crisis put a dent in many investors’ psyches (along with their portfolios) and they’ve been slow to return again. However, along with market appreciation, investor flows have seen at least streaks of exuberance over the past 18 months, boosting investment levels.
Yes, there is still room to go (less than 5 percentage points now) to reach the bubble highs of 2000. However, one flawed behavioral practice we see time and time again is gauging context and probability based on outlier readings. This is the case in many walks of life from government budgeting to homeowner psychology to analyzing equity valuations. The fact that we are below the highest reading of all-time in stock investment should not lead one’s primary conclusion to be that there is still plenty of room to go to reach those levels.
There are no doubt many investors who are still wary of returning to the stock market due to the two cyclical bear markets in the past dozen years. However, while there may be a certain level of investor mistrust, the moniker of “most hated bull market of all-time” does not seem appropriate. It should not be lost on investors that we are at the second highest level of stock investment ever, behind only the most speculative stock blowoff in U.S. history.”
If you’re interested in the “all-access” version of our charts and research, please check out our new site, The Lyons Share. You can follow our investment process and posture every day — including insights into what we’re looking to buy and sell and when. Thanks for reading!
_____________
Disclaimer: JLFMI’s actual investment decisions are based on our proprietary models. The conclusions based on the study in this letter may or may not be consistent with JLFMI’s actual investment posture at any given time. Additionally, the commentary provided here is for informational purposes only and should not be taken as a recommendation to invest in any specific securities or according to any specific methodologies. Proper due diligence should be performed before investing in any investment vehicle. There is a risk of loss involved in all investments.


1 Comment