
Investors Jump Ship At Record Pace During Correction
Based on one measure of trading activity, the recent stock market correction resulted in the hastiest retreat in investor sentiment on record.
In analyzing markets, we try to keep an open mind, considering all data points, bullish or bearish. It’s not that we are trying to be fair and balanced for harmony sake. It’s because to do otherwise would be a disservice, not only to our clients and subscribers, but to our own investment prospects. To dismiss one side of the analysis picture would be to dismiss a potential market outcome. And if that outcome turns out to be reality, then God help us, and our P&L.
We bring up this topic as it relates to our post from Tuesday which highlighted the fact that, in January, the UM Survey of Consumers reported the highest level of investor optimism in the history of the survey…by far. Of course, that immediately preceded the recent wicked drawdown in the stock market. And while some comeuppance following such optimism was not surprising, surely there has been some retreat in investor exuberance following the correction. The question is how much of a retreat.
We may have gotten an answer in the form of another investor survey, TD Ameritrade’s Investor Movement Index, or IMX. From TDA’s website, the IMX “gives you a snapshot of investor sentiment…by analyzing and averaging the holdings/positions, trading activity, and other data from real portfolios held by real investors”. While there is certainly an “unknown” factor to the IMX, the fact that it tracks real money movement as opposed to a poll or survey makes it attractive to us as a sentiment indicator.
So what message is the IMX sending right now? It’s telling us that investors got royally spooked by the drawdown in stocks and up-tick in volatility over the past 6 weeks. At least that is our conclusion based on the fact that the February reading of the IMX registered a decline roughly twice as large as any other in the 8-year history of the indicator.
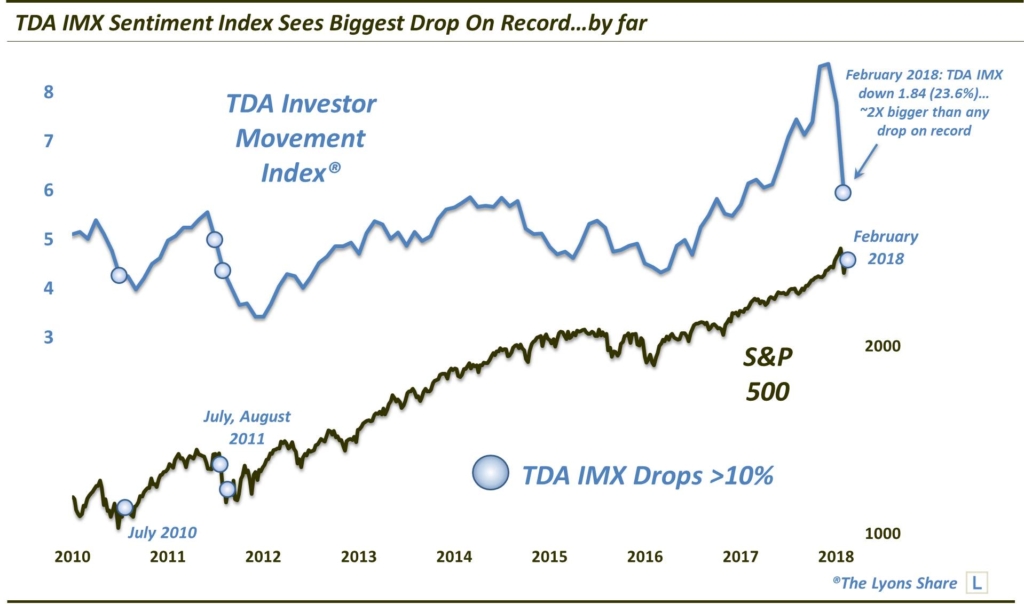
Specifically, the IMX fell from 7.79 to 5.95 in February, a drop of 1.84 points. Going back to 2010, the previous biggest monthly drop in the IMX was .80 — the month before as the correction got underway at the end of January. Prior to that, the largest decline was in August of 2011 when the IMX fell 0.63 points. So, last month’s decline was essentially 3 times as large as the previous record.
Of course, the decline has to be viewed in the context of the elevated levels at which the IMX has resided over the past 12 months. As you can see in the chart, for the first 7 years of the survey, it never rose above a level of 6. A year ago, it rose above that mark and has remained above it until the current monthly reading. Furthermore, the IMX had accelerated into the end of 2017, reaching as high as 8.59 in December. Considering the indicator had never before been above 6, perhaps it was over-extended and due for some mean-reversion. Thus, the recent decline in the IMX may have largely been about merely removing excesses and restoring some balance to the indicator.
This is all speculation as A) the IMX is a relatively new indicator so we don’t have extensive insight into the expected behavior of the indicator, and B) it is a proprietary indicator meaning we don’t have extensive insight into even its construction. That said, the massive decline last month still strikes us as noteworthy given the behavior of the IMX over the limited history that it does offer.
For example, on a percentage basis, the February drop marked a loss of 23.6%, nearly doubling August 2011’s previous record decline of 12.6%. Other large monthly declines (i.e., over 8% occurred during the following months:
- July 2010
- August 2011
- July 2011
- October 2011
- October 2014
- September 2015
- January 2016
- January 2018
- February 2018
The July 2011 and January 2018 instances did not see major stock market weakness. However, interestingly enough, they did immediately precede sharp corrections. Each of the other months saw either major weakness in the stock market, or marked the end of sharp corrections. They also preceded extensive rallies in stocks in the intermediate-term. That is one of the most important takeaways here.
Another, more philosophical, takeaway is merely the observation that investors indeed got spooked by the recent correction. This may be helpful as we consider our query from the post on Monday. How much of the investor exuberance that existed leading up to the correction was wrung out, at least in the short-term? According to the IMX indicator, it was quite a bit. At a minimum, the IMX does not indicate that investors were heavily engaged in a “buy the dip” campaign as the correction unfolded.
There’s no guarantee that the correction process is over. Furthermore, the elevated levels of optimism indicated by the UM survey and others may have longer-term negative implications to them. However, if the TDA IMX survey is any indication, a good deal of the short-term excessive bullishness may have been removed and that condition may contribute to a scenario where stocks can commence another intermediate-term rally at some point in the near future.
If you’re interested in the “all-access” version of our charts and research, please check out our new site, The Lyons Share. You can follow our investment process and posture every day — including insights into what we’re looking to buy and sell and when. Thanks for reading!
_____________
Disclaimer: JLFMI’s actual investment decisions are based on our proprietary models. The conclusions based on the study in this letter may or may not be consistent with JLFMI’s actual investment posture at any given time. Additionally, the commentary provided here is for informational purposes only and should not be taken as a recommendation to invest in any specific securities or according to any specific methodologies. Proper due diligence should be performed before investing in any investment vehicle. There is a risk of loss involved in all investments.


