
“Sell In…” May Be Sound Advice This Year
There is some evidence to suggest that stock investors would be well served by selling in May and going away this year.
One of the most famous of all of Wall Street’s trading bromides is “Sell In May & Go Away”. Of course, the saying refers to the tendency of stocks to perform worse during the 6 months from May through October than they do from November through April. Perhaps the reason why it is still so popular is that, unlike some of Wall Street’s other sayings, there is actually solid historical evidence to back it up, including recent history.
Specifically, here are the average returns in the Dow Jones Industrial Average during the 2 periods since 1900:
- November-April: +5.45%
- May-October: +1.61%
Not only does the average return for the May-October period lag badly, but the consistency of positive returns has been less reliable:
- November-April: 69% Positive Returns
- May-October: 61% Positive Returns
Plus, as mentioned, unlike many seasonal tendencies that lose their effectiveness over time as the edge gets arbitraged away, the Sell In May pattern has held true even as of late. For example, 7 of the last 8 years, 11 of the last 13 years and 19 of the last 24 years saw the Dow stronger from November-April than from May-October.
So is there any thing that bulls can hang their hat on during the forthcoming 6 months? Well, first of all, despite the fact that May-October has generally lagged its 6-month counterpart, the historical average return for the period is still positive. So it’s not like the whole period has been a disaster, though there have certainly been some of those.
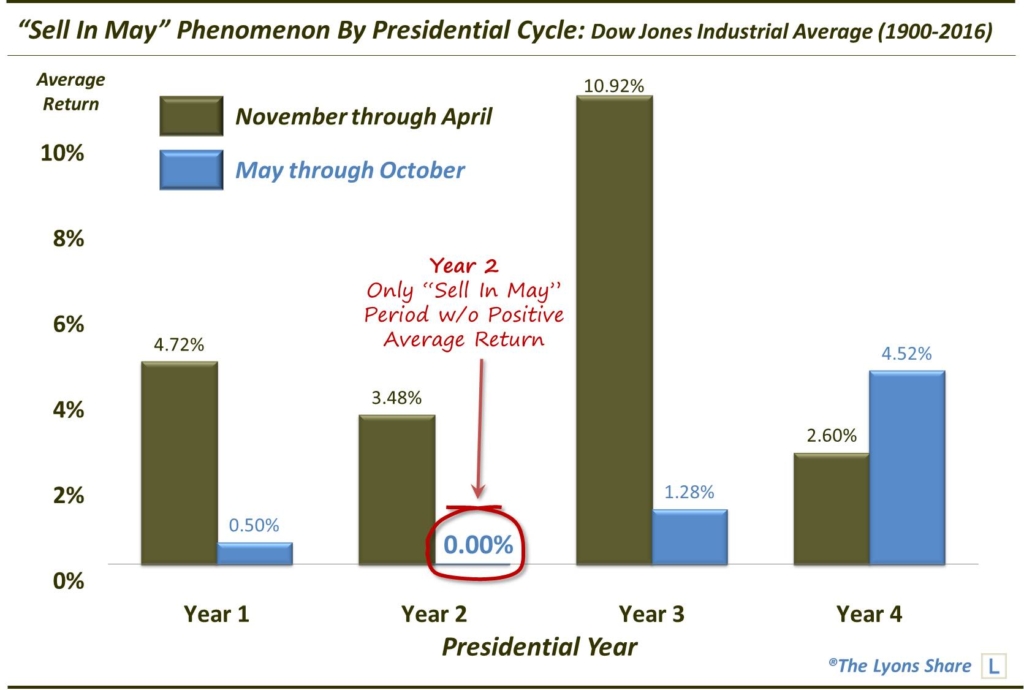
In parsing the data, however, we have found one historical trend that may suggest that the “Sell In May…” advice may be better served this year than most. It is based on the (also relatively consistent) 4-year Presidential Cycle. Naturally, the average Sell In May returns are not uniform across all years. And specifically, we see dispersion, and a wide one at that, among the 4 years within the Presidential Cycle. For example, during “Year 4’s”, the May-October average returns actually exceed those of the November-April period.
It is a different story in “Year 2’s”, however. In fact, at +0.00%, the average May-October return during Year 2’s is the worst of any of the 4 years.
We will say that this seasonal tendency is far down on the list of decision-makers for us as it pertains to these upcoming 6 months. We have our models and indicators that we track which, as always, will guide our investment posture. That said, to the extent that the Presidential Cycle does exert influence on the “Sell In May…” pattern this year, there is evidence to suggest that investors may be well served to follow the advice.
If you’re interested in the “all-access” version of our charts and research, please check out our new site, The Lyons Share. You can follow our investment process and posture every day — including insights into what we’re looking to buy and sell and when. Thanks for reading!
_____________
Disclaimer: JLFMI’s actual investment decisions are based on our proprietary models. The conclusions based on the study in this letter may or may not be consistent with JLFMI’s actual investment posture at any given time. Additionally, the commentary provided here is for informational purposes only and should not be taken as a recommendation to invest in any specific securities or according to any specific methodologies. Proper due diligence should be performed before investing in any investment vehicle. There is a risk of loss involved in all investments.


