
Active Managers Move “All In” Again (PREMIUM-UNLOCKED)
This is a free look at the type of research and analysis we highlight for Premium Members every day at The Lyons Share
According to one survey, active investment managers are presently more than 100% invested, on average.
With the popular averages still well below their January highs, we’ve been wondering if investors noticed the recent strength in other segments of the equity market. For example, groups like small-caps and technology stocks have recovered their entire post-January declines and have moved on to new highs. Well, based on one survey of investment positioning, it appears as though there is one group of investors taking notice — active investment managers.
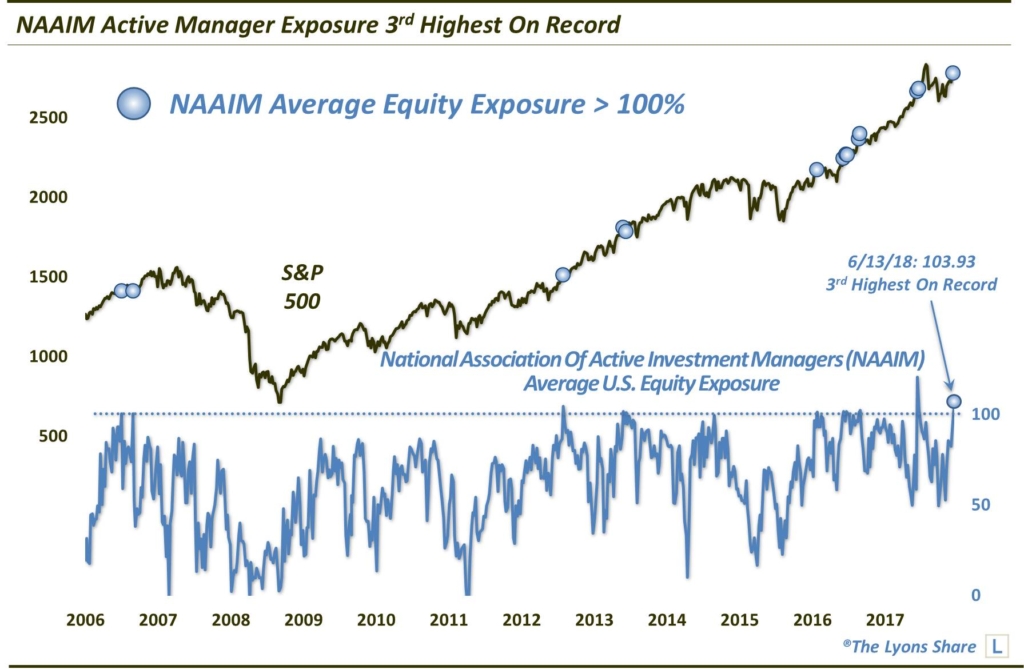
The National Association of Active Investment Managers, or NAAIM, is made up of Registered Investment Advisors and other money managers who employ active or tactical investment strategies as opposed to buy-&-hold and passive asset allocation. For the most part, the goal of such strategies is to reduce investment risk by applying processes to mitigate losses when they view markets as high-risk. Apparently, this group sees very little risk in the market at this time. That conclusion is based on the latest reading of the NAAIM Exposure Index, a survey of the group’s collective equity allocation.
That’s because, as of last week, these active managers have an average of nearly 104% exposure to the stock market. That means that the average manager is presently leveraged long in the stock market. That is the 3rd highest reading in the survey’s 12-year history, and the 12th unique reading over 100%.
Of course, the natural inclination is to think that, from a contrarian perspective, this show of extreme collective bullishness must be troublesome for stocks. However, from strictly a historical perspective, the contrarian “warning signal” based on bullish sentiment extremes in the Exposure Index is far from clear-cut. So before you go and sell all of your equities, consider the track record of the survey’s historical extreme bullish readings.
Specifically, let’s look at the performance of the S&P 500 following historical readings of over 100% average equity exposure on the Exposure Index (a few of the dates were reasonably close together, but not adjacent so we considered them as separate events).
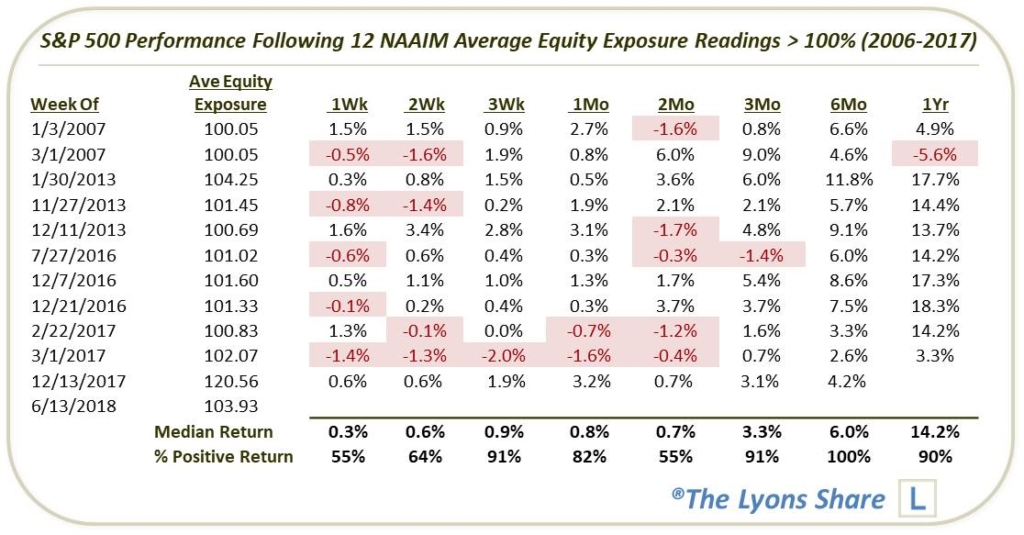
As you can see, while the first few weeks were a toss-up (a duration that short typically is), the S&P 500 was higher all but 1 time after 3 weeks and 3 months — and higher 6 months later every time. Hardly a contrarian “sell signal”.
What’s the bottom line? While historical precedents do not necessarily bear it out statistically, we would rather see skeptical sentiment from most any group, rather than consensus bullish readings. But while we would not necessarily categorize this data point as a buy signal, I think we can definitively say that an Equity Exposure reading this high is not necessarily a death knell for the rally by any means.
FYI, our RIA firm, J. Lyons Fund Management, Inc., has been a member of NAAIM and a participating member of the NAAIM Exposure Index for many years. In fact, JLFMI’s president, John S. Lyons, was among the group’s charter members nearly 30 years ago. As such, we are quite partial to the group and its philosophy.
If you’re interested in the “all-access” version of our charts and research, please check out our new site, The Lyons Share. You can follow our investment process and posture every day — including insights into what we’re looking to buy and sell and when. Thanks for reading!
_____________
Disclaimer: JLFMI’s actual investment decisions are based on our proprietary models. The conclusions based on the study in this letter may or may not be consistent with JLFMI’s actual investment posture at any given time. Additionally, the commentary provided here is for informational purposes only and should not be taken as a recommendation to invest in any specific securities or according to any specific methodologies. Proper due diligence should be performed before investing in any investment vehicle. There is a risk of loss involved in all investments.


