
A Very Lowly New High (PREMIUM-UNLOCKED)
The following is a free look at the type of research and analysis that members of The Lyons Share receive on a daily basis. We are providing this free look due partially to the importance of the data discussed herein as well as the potential significance of the current market juncture.
Despite the fact that the major averages are hitting 52-week highs, we are observing a proliferation of New Lows among individual stocks — a condition that has proven disadvantageous at times in the past.
In recent weeks, we have discussed the phenomenon that we call the “junkie market”. That refers to a market in which the major averages are at or near 52-week highs while, at the same time, there is an abundance of both stocks hitting new highs as well as new lows (i.e., too many highs and lows). This is a condition that we have found to occur, often times, near market tops of some significance. There is, however, a worse potential set of conditions — that being a high in the market that occurs with an abundance of just new lows. We are witnessing such a condition now.
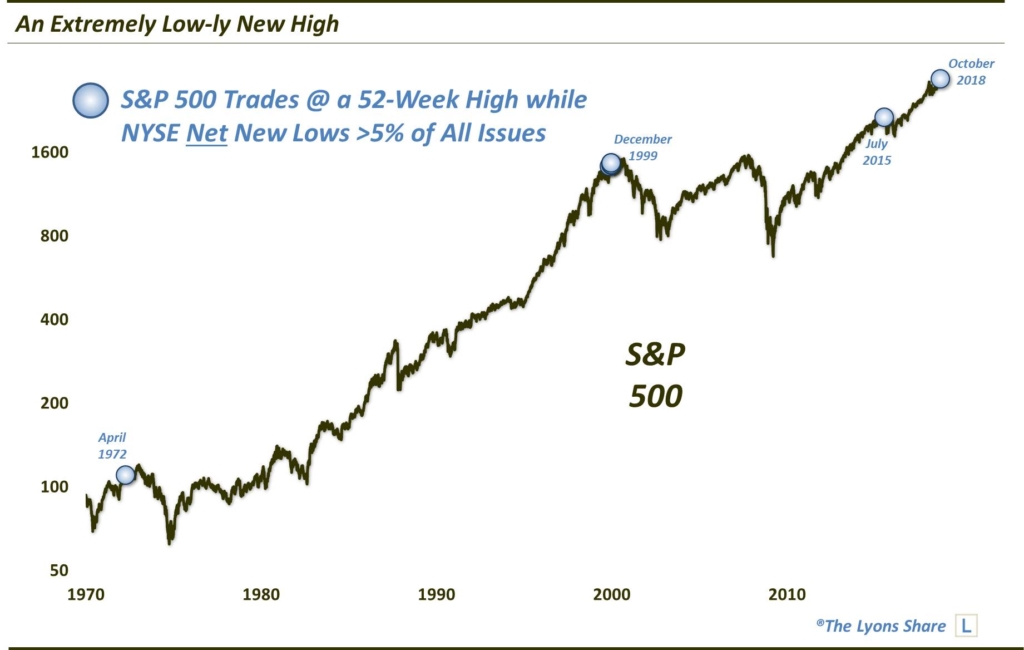
Over the past few days, while the large-cap averages have hit new highs, there have been more new lows than new highs on the NYSE. Yesterday saw an egregiously high number of net new lows (i.e., new lows minus new highs). Specifically, according to our data source, there were 339 issues hitting new lows on the exchange, or a whopping 9% of all issues traded. At the same time, there were 119 new highs. The difference between the two, i.e., 220 net new lows, represents over 5% of all issues on the NYSE.
How unusual is that? Well, for a day in which the S&P 500 traded at a new 52-week high (on an intraday basis), it was just the 4th unique occurrence since 1970. The other dates were 4/13/1972, 7/20/2015 and a handful of dates at the end of 1999. From a glance at the chart, those were obviously not advantageous times to be piling into stocks.
Since it’s difficult to learn much from just a few data points, if we expand our parameters a bit, we obviously come up with more occurrences — a fact that might make our study a bit more robust or useful. In the following case, we expand our search to all days in which the S&P 500 traded at a new high while net new lows exceeded 1% of all NYSE issues. This loosening of the parameters actually results in just 29 dates since 1970 — but definitely a few more interesting ones.
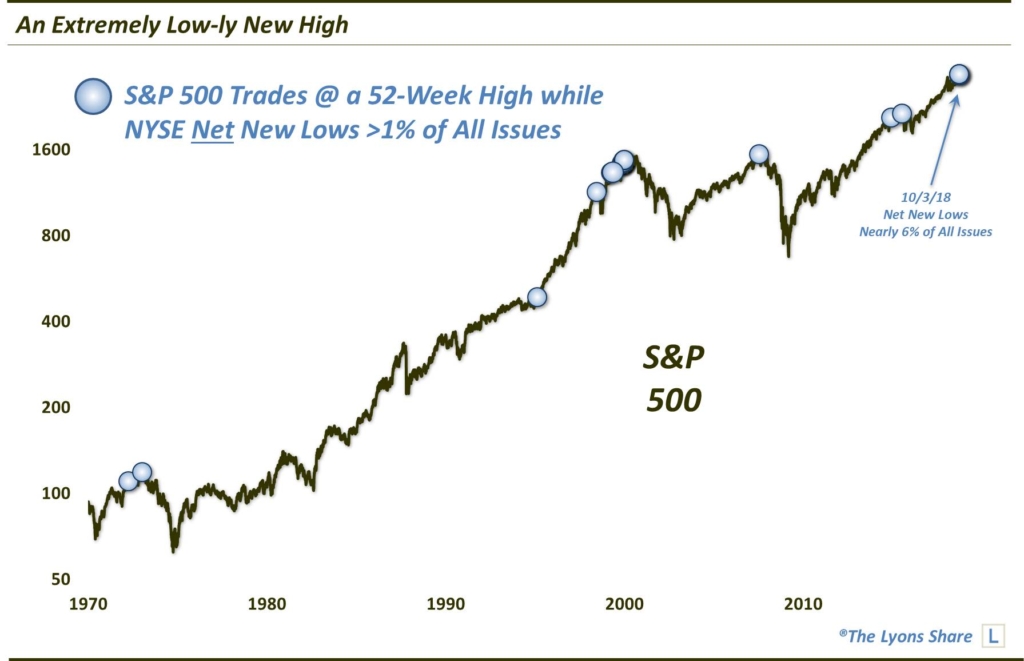
As the chart shows, we now have occurrences at the precise cyclical tops in 1973 and 2007 as well as near a few more shorter-term tops. Then there is the curious occurrence in 1995 which preceded a multi-year blowoff. Here are all of the dates and the aggregate forward returns in the S&P 500 (dates in bold are those with >5% net new lows).
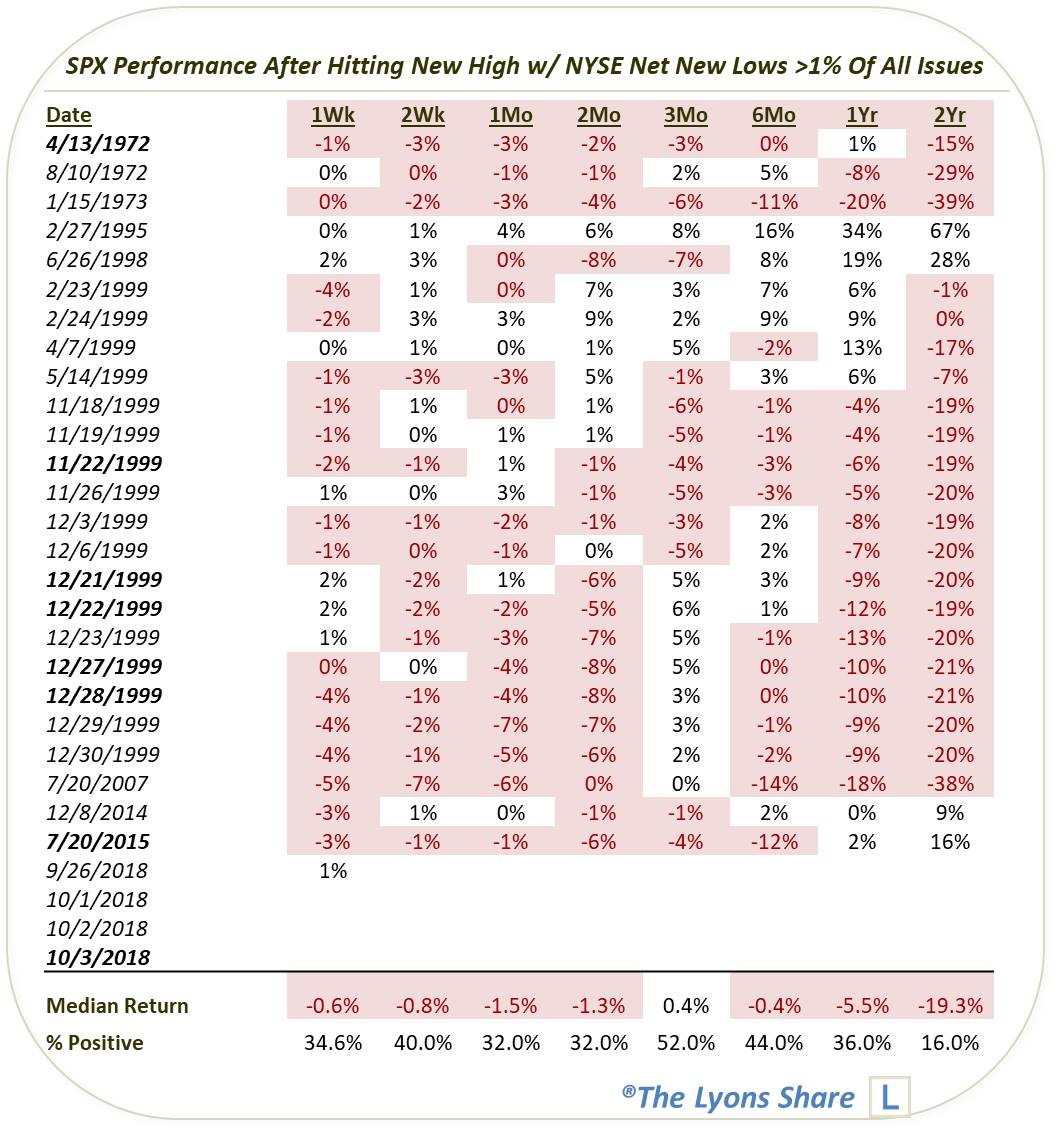
As you can see, the list is dominated by those occurrences in 1999. Even accounting for that large cluster, however, the returns going forward are exceedingly negative. It is especially so in the shorter intermediate-term of 1-2 months — and perhaps most alarming, in the long-term, i.e., 1-2 years. The only occurrence that really escaped any damage was the one in 1995. However, the evidence would suggest that one not focus on that “outlier, but the preponderance of occurrences.
We have written on a number of red flags in the equity market over the past few months. However, some warnings are more serious than others. In our book, this one qualifies as that.
What, if anything, are we doing about this serious red flag? Become a member of The Lyons Share and get an “all-access” pass to our charts and research — as well as a daily inside look at our investment process, including insights into what we’re looking to buy and sell and when. Thanks for reading!
_____________
Disclaimer: JLFMI’s actual investment decisions are based on our proprietary models. The conclusions based on the study in this letter may or may not be consistent with JLFMI’s actual investment posture at any given time. Additionally, the commentary provided here is for informational purposes only and should not be taken as a recommendation to invest in any specific securities or according to any specific methodologies. Proper due diligence should be performed before investing in any investment vehicle. There is a risk of loss involved in all investments.


