The Mother Of All Support Levels?
U.S. stocks are testing potentially important support stemming back several decades.
When it comes to technical charting levels, there is support…and there is SUPPORT. The former represents minor levels that may be sufficient in a raging B.T.D. bull market. However, in a swift decline like we are witnessing now, the market will make a mockery of such levels, slicing through them as if they have no relevancy at all. In such a decline, it may take the latter type of SUPPORT to halt or at least slow down the descent. The genesis of these SUPPORT levels likely stem back several years, at least. Currently, one market index is testing such key SUPPORT, with several decades of history behind it.
We are talking about the Value Line Geometric Composite (VLG), an index that tracks the median U.S. stock performance among a universe of roughly 1800 stocks. As we have said many times, this is one of our favorite measures of the health and direction of the overall market. And, as we have also said many times, it is helpful to track it because research has shown that 70-80% of the determinant of the trend direction of a particular stock is based on the trend of the overall market.
So what is so significant about this current SUPPORT level? Due to the unique construction of the VLG, its price path looks a bit different than most other equity indices. However, we will say that it does still tend to “obey” the technical and charting techniques that we like to apply. For example, take a look at the VLG’s current proximity, especially from a historical perspective.
In 1998, the VLG topped out at an all-time high level around 510. 9 years later, in 2007, the index again topped out ~510. Fast forward 7 years and we see the index (briefly) top out there one more time in 2014. At the market top in mid-2015, the VLG was finally able to exceed the 510 level — temporarily. After a false breakout, the VLG sold off hard in the subsequent correction. Finally, last fall, the VLG was able to sustainably break out above the 510 level. Well, so far it has been sustainable.
We say that because after topping out just shy of 600 in August, the current correction has brought the index all the way back down to near the 510 level.
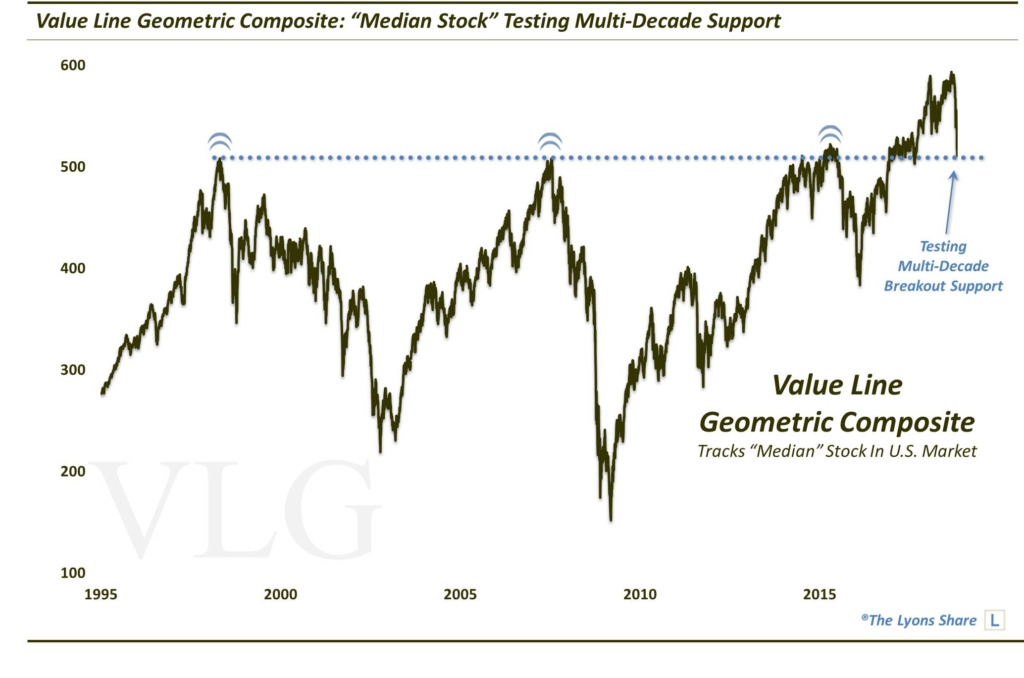
So will this level serve as support — or SUPPORT — for the stock market? That remains to be seen. But, in our view, it is certainly a development that bears monitoring (no pun intended).
If you’re interested in the “all-access” version of our charts and research, we invite you to check out our site, The Lyons Share. FYI, given the current treachorous market landscape, TLS has extended our CRASH SALE through this weekend. So considering the discounted cost and the current treacherous market climate, there has never been a better time to reap the benefits of our risk-managed approach. Thanks for reading!
_____________
Disclaimer: JLFMI’s actual investment decisions are based on our proprietary models. The conclusions based on the study in this letter may or may not be consistent with JLFMI’s actual investment posture at any given time. Additionally, the commentary provided here is for informational purposes only and should not be taken as a recommendation to invest in any specific securities or according to any specific methodologies. Proper due diligence should be performed before investing in any investment vehicle. There is a risk of loss involved in all investments.