Time For Commodities To Bounce?
Broad commodity indices are testing key support trendlines.
On a day when stocks are in full Fed-induced launch mode, we want to turn our attention to an asset class that has been less, er, buoyant of late — commodities. Commodities enjoyed a decent first half of the year before hitting the skids. They have been hit especially hard of late led by crude oil, which has lost a third of its value in just the past 6 weeks. It hasn’t been just crude, however, as demonstrated by the performance of our favorite broad commodity index.
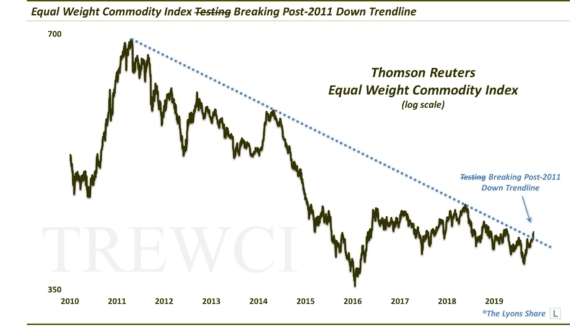
The Thomson Reuters Equal Weight Commodity Index (EWCI) measures the performance of 17 commodities, on an equally-weighted basis: Cocoa, Coffee, Copper, Corn, Soybeans, Cotton, Crude Oil, Gold, Heating Oil, Lean Hogs, Live Cattle, Natural Gas, Platinum, Silver, Soy Oil, Sugar and Wheat. Therefore, in our view, it is a better measure of the state of the commodities complex as a whole versus more popular measures, like the CRB Index which is heavily weighted toward crude. And while the EWCI has had a rough go of it over the past 6 months, it does hold bounce potential right now based on technical charting factors.
We’ve mentioned on a few occasions in the past that the EWCI has been trading in a long-term pennant formation over the past 15 years. The upper bound of the pennant containing prices on the upside is the post-2011 Down trendline. Last May, we mentioned that the index was testing this trendline. The trendline would indeed hold and send prices back down toward the other end of the pennant.
At the other end of the pennant, supporting prices, has been the Up trendline stemming from its 2001 secular low and connecting the 2016 low. In August, the index arrived at the uptrend line as we noted at the time. Once again, the index respected the technical boundaries and bounced for the subsequent few months. Today, we find the EWCI back down testing the lower bound trendline once again.

Will commodities bounce again here? It remains to be seen, but we certainly wouldn’t be surprised by it, especially given another piece of technical evidence potentially bolstering the bounce case. Specifically, the CRB Index is also testing a key, though shorter, trendline of its own — the post-2016 Up trendline.
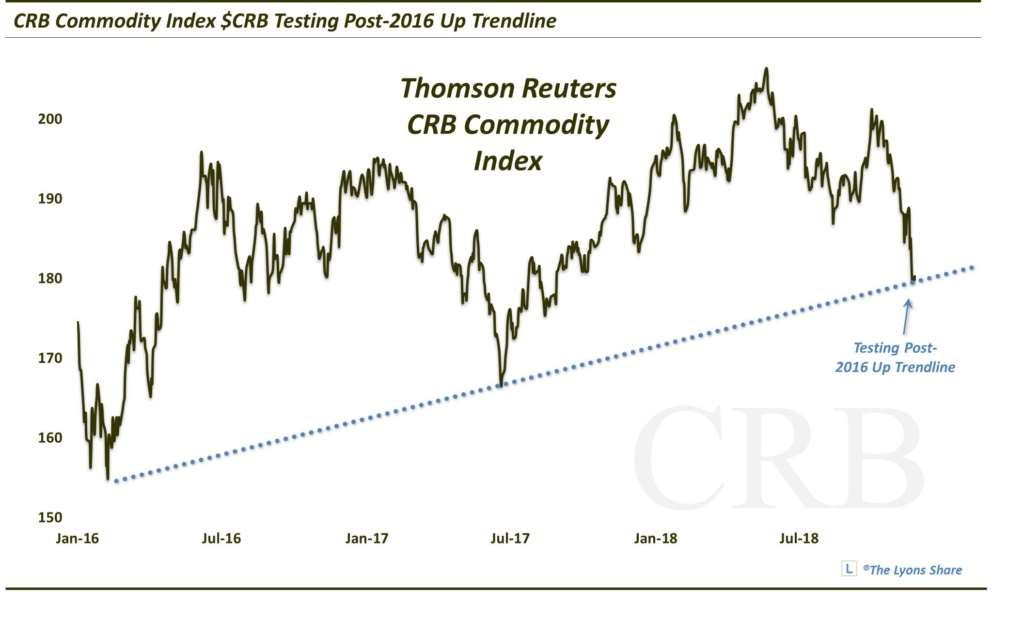
Again, we think commodities *should* manage to bounce here, at least temporarily. The real question is for how long? As TLS members know, let’s just say we don’t expect any “launch mode” type moves out of commodities.
If you’re interested in the “all-access” version of our charts and research, please check out our premium site, The Lyons Share. You can follow our investment process and posture every day — including insights into what we’re looking to buy and sell and when. Given what we believe will be a treacherous market climate going forward, there has never been a more important time to reap the benefits of our risk-managed approach. Thanks for reading!
_____________
Disclaimer: JLFMI’s actual investment decisions are based on our proprietary models. The conclusions based on the study in this letter may or may not be consistent with JLFMI’s actual investment posture at any given time. Additionally, the commentary provided here is for informational purposes only and should not be taken as a recommendation to invest in any specific securities or according to any specific methodologies. Proper due diligence should be performed before investing in any investment vehicle. There is a risk of loss involved in all investments.