
A Year-End Gift From The Volatility Market?
Elevated VIX term structure in December has historically led to year-end rallies.
We’ve talked several times in the past about elevated December readings from the volatility market. Specifically, they have typically led to strength in the stock market into the year-end. That would be a welcomed development for investors who have been subjected to considerable volatility in December this year. In the past, when discussing the topic, we have focused on spikes in absolute readings in the VIX (S&P Volatility Index) — off of at least a near-term low. Our present circumstances would not apply to that study as we are not coming off of a low in the VIX. Thus, we are focusing this time on the elevated readings from the VIX term structure.
Once again, the term structure refers to the various durations of, in this case, the S&P 500 Volatility Indices vs each other. When the near-term indices rise substantially relative to those further out, it can be a sign of trader fear. When looking at the VIX:VXV (1-month:3-month) ratio, a reading above 1.0 is typically considered to be an elevated extreme. Thus, in this study, we are looking at December VIX:VXV readings over 1.0 — and the subsequent reaction by stocks into year-end.
As it turns out, like the absolute spikes in volatility, elevated term structure readings in December have led to year-end rallies…every time. Specifically, prior to this year, since the inception of the VXV in 2007, there have been 16 days in the month of December that saw the VIX:VXV ratio close above 1.0. Through year-end, the S&P 500 saw positive returns after every one of them
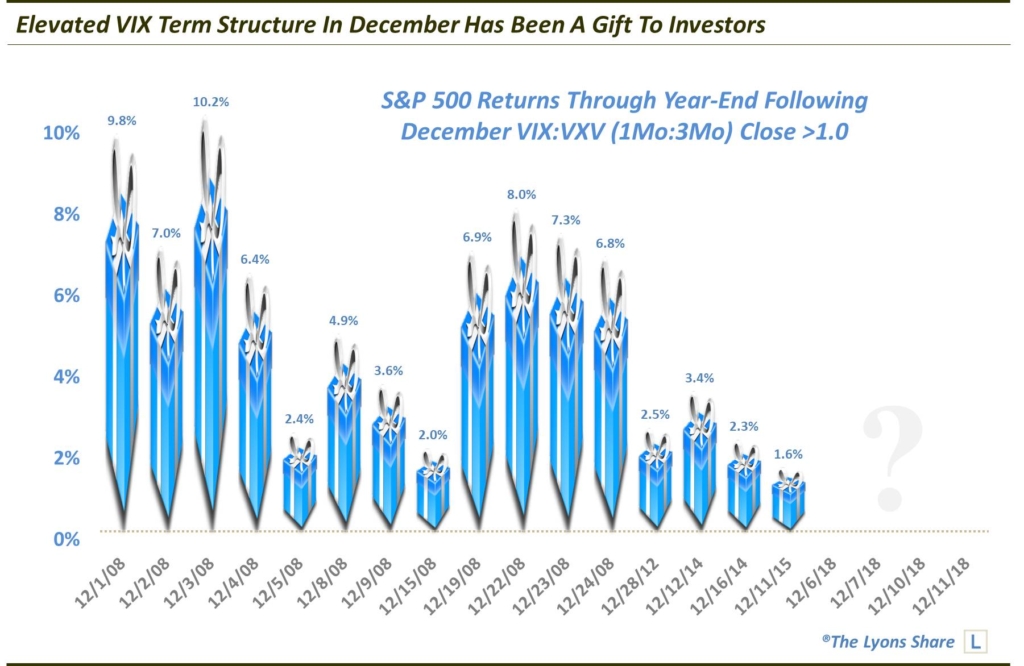
Granted, 12 of the 16 occurrences took place in 2008. However, that may give investors some solace that a year-end rally is still a possibility since, if there was ever a more volatile year-end than this one, it was 2008. Beyond 2008, there were also year-end rallies following elevated volatility term structure readings in 2012, 2014 (2) and 2015.
This month has seen 4 VIX:VXV closes above 1.0, so far. Will a year-end rally lead to positive returns again, and keep this perfect streak alive? That remains to be seen. We certainly have seen in the past that once we recognize a tendency, it has a tendency to change. That speaks to the potential sheer randomness of the results of this study. Not to mention, each year comes with its own unique set of micro and macro circumstances. However, in a season where bears have been the recipients of most of the good cheer, this may be one potential gift for the bulls.
If you are interested in an “all-access” pass to our charts, research and investment moves, we invite you to further check out The Lyons Share. There, we post all of the noteworthy chart developments for members — EVERY DAY. You can also follow our investment process and posture on a daily basis — including insights into what we’re looking to buy and sell and when. Given what we believe will be a treacherous market climate going forward, there has never been a more important time to reap the benefits of our risk-managed approach. Thanks for reading!
_____________
Disclaimer: JLFMI’s actual investment decisions are based on our proprietary models. The conclusions based on the study in this letter may or may not be consistent with JLFMI’s actual investment posture at any given time. Additionally, the commentary provided here is for informational purposes only and should not be taken as a recommendation to invest in any specific securities or according to any specific methodologies. Proper due diligence should be performed before investing in any investment vehicle. There is a risk of loss involved in all investments.

1 Comment