
Sentimental Shift (PREMIUM-UNLOCKED)
The following post was originally issued to TLS members on March 20, 2020.
Sentiment has shifted 180 degrees in the past month; does it now represent a contrarian buy signal?
In mid-January, we posted an assessment of investor sentiment towards stocks (1/15: Getting Sentimental). At the time, sentiment was sky-high and hedging of any kind was really a foreign concept for investors. Thus, while not directly generating any defensive signals, the situation did have us on guard for a shift in market fortunes. Fast forwarding 2 months — what an epic shift it has been.
The shift has not just been in stock prices, but in the sentiment data as well. In fact, sentiment has shifted a complete 180 degrees. While there are a myriad of sentiment measures that we follow, we highlighted 2 in the January post which we’ll update here.
First off, from the options market, we spotlighted the CBOE Equity Put/Call Ratio (CPCE). At the time, it was hitting one of its lowest readings in our database going back to 2003. In other words, it was indicating money going into calls (bets on a rising market) relative to puts (bets on a declining market) at one of the fastest clips ever. Using a 21-day average, the ratio hit its lowest level in about 6 years and 3rd lowest on record. Fast forward to now and we see the 21-day average CPCE at its highest level (0.86) since 2008 and 3rd highest on record. Suddenly, money is pouring into puts.
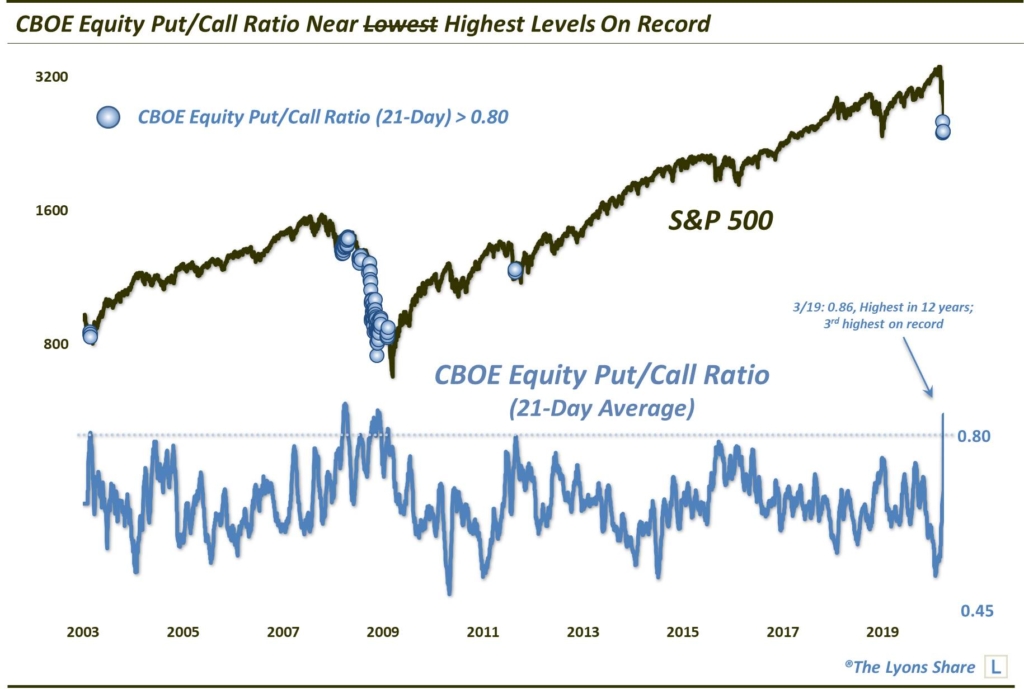
So is this a contrarian buy signal? Looking at previous readings above .80, we find a mixed bag. Following readings in February 2003, the S&P 500 continued to drop for another 2-3 weeks before bottoming and launching a multi-year cyclical bull market. In August 2011, similar readings marked the initial low during the correction at the time. The SPX would chop around for another 6 weeks before successfully re-testing the lows and embarking on a substantial, sustainable rally.
Then we have the 2008-2009 instances. As the chart shows, readings occurred near the lows of the initial down-wave in the spring of 2008. Following a bounce into summer, however, more readings began to crop up during the summer and fall as the bear market losses accelerated. In that instance, the sentiment “extreme” failed to contribute to any meaningful advance whatsoever.
Therefore, as we said, historical precedents represent a mixed bag. If this is simply a correction or short-term bear market, these readings could represent a “blood in the streets” type of buying opportunity. However, if this is the beginning of a longer-term cyclical bear market, the readings may have little lasting ramifications.
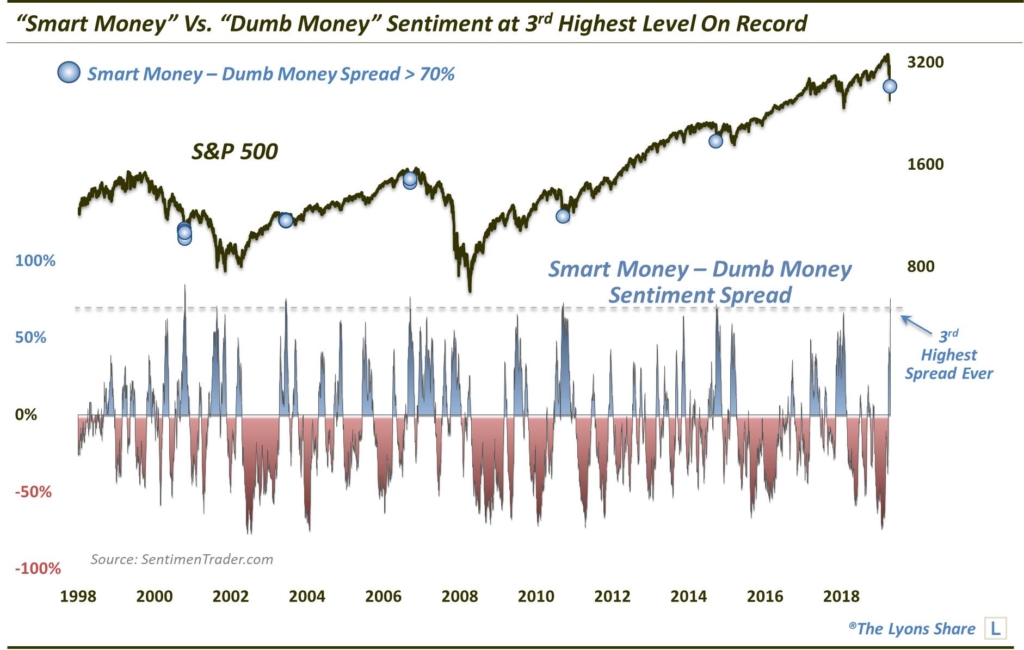
The other sentiment indicator we looked at was even more important. As we stated in the post, “perhaps the most important gauge that we use comes from our colleague Jason Goepfert at Sentimentrader.com. He calculates a collection of both typically contrary indicators (Dumb Money) and typically non-contrary indicators (Smart Money).” At the time, the spread between bullishness among the Smart Money and the Dumb Money had become extremely tilted toward the latter. In fact, the spread hit the 3rd lowest level on record, going back to 1998. That condition, as we mentioned, was a significant potential warning sign. The complete opposite is the case now. As of March 13, the Smart Money – Dumb Money spread reached the 3rd highest level on record (0.74)
What are the potential implications of this 180 shift? Looking objectively, quantitatively and historically, the takeaway should be bullish — to a point. Here is the subsequent performance in the S&P 500 following past readings in the indicator over 0.70.
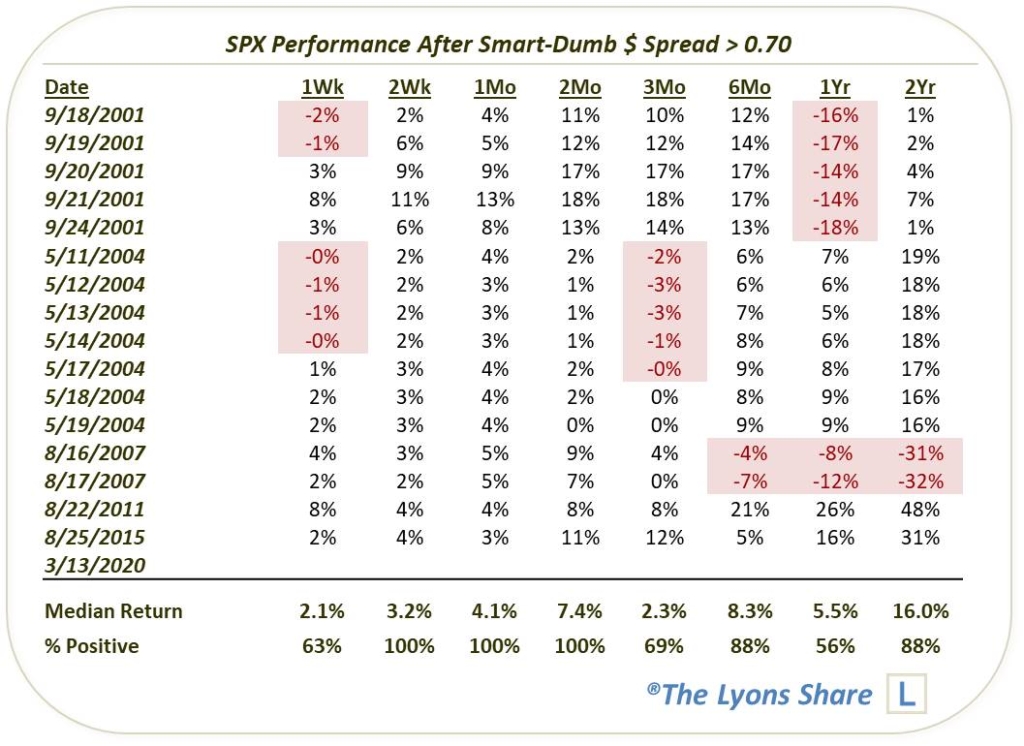
As the table indicates, the 1-week forward returns were a mixed bag. Again, as the present reading in question was March 13, today is 1 week. On the bullish side of the ledger, each of the readings in 2001, 2004, 2007, 2011 and 2015 saw positive returns on all time-frames from 2 weeks to 2 months. While past performance does not guarantee future results, that is at least a positive-leaning data point.
Unfortunately, to the extent that we can extrapolate positive implications out to 2 months, we cannot go beyond that duration. As indicated, the 2001 and 2007 instances led to further, long-term bear markets. We certainly cannot rule that out in our present case. In fact, that is our expectation.
In summary, sentiment has completely reversed course over the past 2 months. Generally speaking, the implications should be positive in the short to short-intermediate term. However, it is not an unfettered buy signal as the potential for a longer-term bear market is significant.
As always, stay tuned to our DSS posts for further developments — they provide the most current updates to our investment portfolio and outlook. Also, if you know of anyone who’s portfolio has been decimated, or anyone who might benefit from our risk-management, we appreciate any referrals. We will make it worth your while as well. Thank you!
_____________
Disclaimer: JLFMI’s actual investment decisions are based on our proprietary models. The conclusions based on the study in this letter may or may not be consistent with JLFMI’s actual investment posture at any given time. Additionally, the commentary provided here is for informational purposes only and should not be taken as a recommendation to invest in any specific securities or according to any specific methodologies. Proper due diligence should be performed before investing in any investment vehicle. There is a risk of loss involved in all investments.


