
Stocks Vs. Volatility – Standoff Gets Flipped
This time, stocks and volatility experienced rare simultaneous drops.
In recent weeks, we have written about the odd behavior between stocks and volatility, two markets that generally moved in opposite directions. Specifically, though stock indices enjoyed a persistent upward ascent, their corresponding volatility indices remained buoyant, even rising on several days along with the stock indices. What was our takeaway from this unusual standoff? As we mentioned in one of the posts,
“…it would not surprise us if this data point was an early warning signal in the buildup to some variation of a market top. We will at least reiterate that, based on our research, the standoff between buoyant stocks and volatility is not an ideal condition for stock investors…”
In other words, the volatility market generally wins these standoffs and it did again this time. One didn’t even have to wait too long. As the recent buoyant volatility suggested, the stock run had gotten a little ahead of itself and the air pocket collapse over the past few days proved as much.
Yesterday, however, we saw the standoff flipped. In the Nasdaq, specifically, while the Nasdaq 100 (NDX) dropped to the tune of -4.8%, the Nasdaq Volatility Index (VXN) actually fell as well (-1.7%). This was just the 5th day on record that saw the VXN lower on a day the NDX fell by at least 4%. And, as the chart shows, it was just the 10th such day when the NDX was down by >3%.
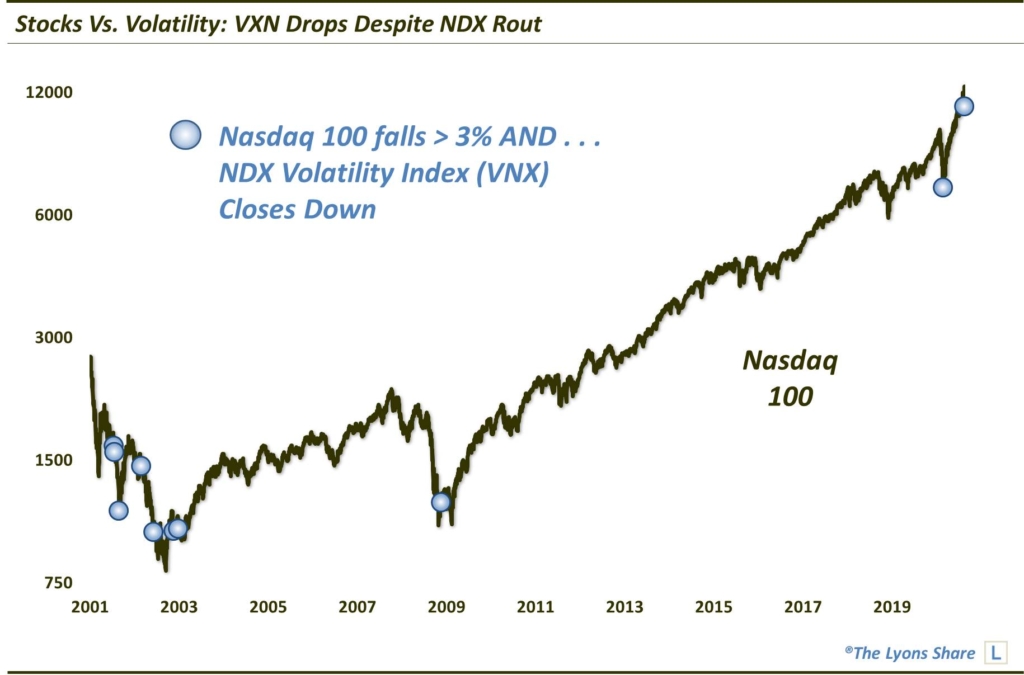
So with the situation reversed — assuming that volatility has it correct again — can we conclude that the selling of the past few days has gotten overdone? Well, today’s rally would suggest that, as would a few of the historical precedents, e.g., at the low in March as well as following 9/11. Furthermore, 7 of the 9 prior incidents saw the NDX higher 1 and 3 days later.
However, these “reverse standoffs” did not always mark the final low in the stock market. Past 3 days, the prospects for a higher NDX was essentially a 50/50 proposition. Furthermore, earlier in 2001 as well as in mid-2002, we saw occurrences that led to further heavy selling prior to the end of the respective declines. And our current semi-close proximity to NDX 52-week highs probably indicates more similarity between those precedents than it does to incidents occurring near cyclical bear markets.
Thus, while this signal may indicate that recent stock selling became a bit overdone — thus, prompting today’s rally — extrapolating the signal out to longer-term durations may be a step too far.
How much “stock” are we putting into this data point? How is it impacting out investment posture? If you’re interested in an “all-access” pass to all of our charts, research — and investment moves — please check out our site, The Lyons Share. You can follow our investment process and posture every day — including insights into what we’re looking to buy and sell and when. Thanks for reading!
_____________
Disclaimer: JLFMI’s actual investment decisions are based on our proprietary models. The conclusions based on the study in this letter may or may not be consistent with JLFMI’s actual investment posture at any given time. Additionally, the commentary provided here is for informational purposes only and should not be taken as a recommendation to invest in any specific securities or according to any specific methodologies. Proper due diligence should be performed before investing in any investment vehicle. There is a risk of loss involved in all investments.


1 Comment