After 10-Year Wait, Global Equity Gauge Hits Record High
Following a brief pullback, the Global Dow Index is breaking above its all-time highs set 10 years ago.
A month ago, we pointed out a potential speed bump facing the global equity rally. The global equity barometer in question was the Global Dow Index (GDOW), an equally-weighted index of 150 of the largest stocks in the world. The potential speed bump was the GDOW’s all-time high of 2878, set back in 2007. On August 7, the GDOW posted a closing price of 2878.99, prompting our post about the potential resistance at that level based on the former highs hit 10 years ago.
We didn’t suggest that the rally was necesarrilly over, but that it may pause. Specifically, we stated:
“…one reason why we like using the Global Dow as a barometer of the global equity market is because it conforms well to technical charting analysis. And certainly classical charting analysis would suggest that 10-year old all-time highs should at least pose as temporary resistance following a decade-long round trip.”
The GDOW would indeed be rebuffed by the 10-year old resistance, confirming once again the relevance of key historical price points. The index spent the next few weeks in a steady decline. However, the key question, as we mentioned in the August post, was:
“…how temporary, and how much downside risk may there be prior to another potential breakout?”
We answered that question to the best of our estimation in a Premium Post at The Lyons Share:
“How much of a pullback should we look for? Working backwards a little bit, we see the 2015-2016 decline as a key in judging the potential for the post-2016 rally. Using that decline, an eventual target of 3025 seems to be reasonable, if not likely, based on Fibonacci work. Whether that approximate 5% of additional upside above the current 2879 highs is worth one’s while or not is up to them. However, a pullback into a more inviting level would certainly improve the risk/reward characteristics of a potential long play.
Working off of that 3025 level does help us to confirm the key Fibonacci levels below within the post-2016 rally from which to originate our analysis. And based on that analysis, we would look for a pullback to at least the 2825 level, and ideally the 2810 level before trying a trade. Those levels may offer the rising 50-day simple moving average as additional support, depending upon its whereabouts at the time.”
Fast forwarding to today, let’s look back at the past month to see exactly what transpired following the GDOW’s August test of its 10-year old highs, and the key levels involved.
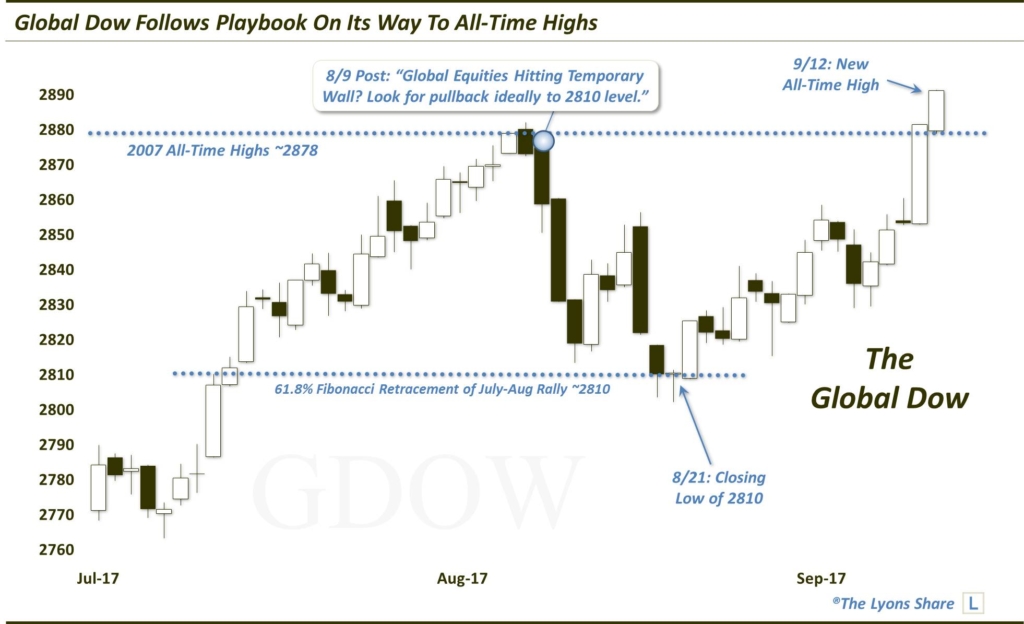
As the chart shows, the GDOW immediately pulled back from the 2878 all-time high, falling over the next few weeks. The index would make a closing low for the move on August 21 of 2810.42, exactly at the “ideal” entry point we were looking for. And after a gradual 3-week bounce, the GDOW exploded higher to start this week, closing at a new all-time high yesterday. Here is the zoomed-out picture.
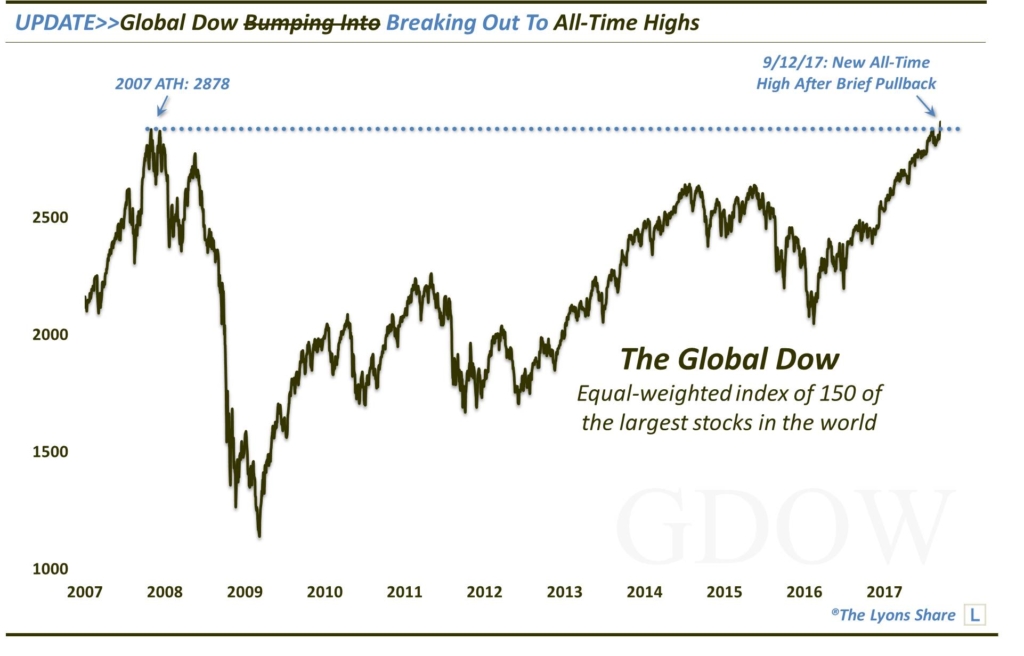
So what’s next for the Global Dow? Well, first off, it is always nice when chart set-ups play out exactly as suggested. Secondly, certainly overcoming the 10-year old all-time high was a positive development which opens up further (potentially substantial) upside. The fact that the index pulled back already from the first touch of the all-time highs suggests that it has at least rested somewhat and likely stored up enough energy for a sustainable move to new highs.
Now, given that our equity outlook is not all that optimistic over the intermediate to long-term, it does dampen some of the enthusiasm here. However, even if the U.S. market gets hit sharply, the international markets could still out-perform, or even excel. We have observed — and posted on — positive developments in numerous foreign markets this year. The longer-term prospects, in our view, would seem to be brighter in select spots around the world than domestically. Based on this development, the short-term prospects don’t look too bad there either.
If you’re interested in the “all-access” version of our charts and research, please check out our new site, The Lyons Share. Considering what we believe will be a very difficult investment climate for awhile, there has never been a better time to reap the benefits of our risk-managed approach. Thanks for reading!
“Earthrise” photo by NASA.
_____________
Disclaimer: JLFMI’s actual investment decisions are based on our proprietary models. The conclusions based on the study in this letter may or may not be consistent with JLFMI’s actual investment posture at any given time. Additionally, the commentary provided here is for informational purposes only and should not be taken as a recommendation to invest in any specific securities or according to any specific methodologies. Proper due diligence should be performed before investing in any investment vehicle. There is a risk of loss involved in all investments.