Individual Stocks Struggling To Keep Up With Nasdaq Rally

We have written many times regarding our belief in the importance of broad participation in a stock market rally. The greater the number of individual stocks participating, the healthier the rally will be. And while it is possible for a relatively few mega-cap stocks to propel the major averages higher by themselves (e.g., 1998-2000), that is a tougher climb for the market given the smaller margin for error. We have seen traces of a thinning out of the current stock rally over the past 12 months or so, with probably the most potentially damaging piece of evidence stemming from the NYSE Advance-Decline Line’s failure to confirm the May high in the averages.
We look at another example today in the number of New 52-Week Highs on the Nasdaq Exchange. While the Nasdaq Composite has been able to continually score new highs (including yesterday), the number of New Highs on the exchange has been unable to materially expand. In fact, the series recently reached a milestone. The number of Nasdaq 52-Week Highs has now gone more than 400 days without making a 52-Week High itself. Historically, this has been a relative rarity when the Composite was hitting new highs.
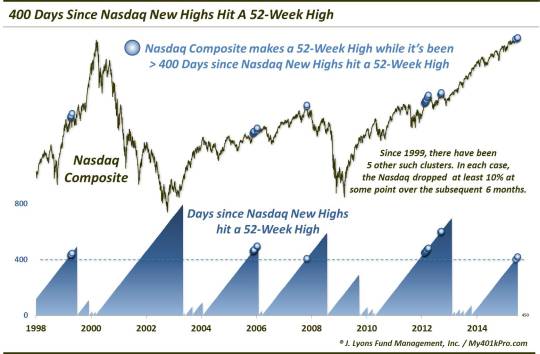
As the chart shows, it is not necessarily the 400-day streak that is the remarkable thing. There have actually been 8 such streaks in the past 30 years. The unusual thing has been for such streaks to coincide with new highs in the average. Before the past few days, there had been a total of 56 days since 1986 that saw the Nasdaq Composite at a 52-week high while the number of New Highs on the exchange had failed to make a 52-week high in over 400 days. They all occurred in 6 distinct clusters:
- November 1992-January 1993: The Nasdaq suffered no ill-effects as it was able to continue a gradual ascent for the next 12 months.
- April 1999: The Nasdaq dropped as much as 10% over the following month before rebounding into 2000.
-
November 2005-January 2006: The Nasdaq dropped as much as 12% over the following 6 months before rebounding into 2007.
- October 2007: The Nasdaq formed an immediate cyclical top.
- February-March 2012: The Nasdaq dropped as much as 10% over the following 3 months before rebounding into the fall.
- September 2012: The Nasdaq dropped as much as 10% over the following 2 months before embarking on the current 2.5-year rally.
With 10% declines following the past 5 occurrences, the after-effects of this development have not been kind to the Nasdaq. That said, not all is hopeless. For starters, the first occurrence did not lead to any downside. Secondly, the rallies were often able to persist for a couple more months before the drawdown occurred. Lastly, despite some ugly declines, only one of the occurrences led to a cyclical top. Each of the others saw the Nasdaq eventually go on to new highs.
As always we are battling to reconcile, or at least appropriately weigh, the positive developments with the negative ones. Earlier this month, we noted that the relative improvement in the Nasdaq New High-New Low situation versus the NYSE was a potential positive sign. However, today’s study suggests that the improvement in the Nasdaq New Highs has not been quite enough to thwart what has historically been a negative harbinger. And while we see that this development is not necessarily a death knell for the Nasdaq rally, it would certainly make its uphill ascent a lot easier if it had more stocks participating.
(Related: NYSE 52-Week Highs Are M.I.A.)
_____________
“Uphill Struggle” photo by stu mayhew.
More from Dana Lyons, JLFMI and My401kPro.
The commentary included in this blog is provided for informational purposes only. It does not constitute a recommendation to invest in any specific investment product or service. Proper due diligence should be performed before investing in any investment vehicle. There is a risk of loss involved in all investments.


