Yesterday’s S&P 500 Reversal Has ZERO Historical Significance
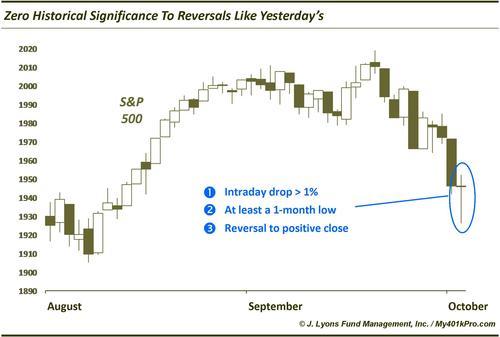
Yesterday’s action in the stock market has generated plenty of speculation regarding a possible bottom following the recent weakness. This stems from the reversal in the major indexes from steep intraday losses to a positive close.

In Candlestick parlance, the daily pattern formed may be considered a hammer, or at least a long-legged doji. Both of these patterns are traditionally considered to be signs of exhaustion to down moves and a possible impending reversal up. Regardless of one’s interpretation, the connotations are bullish. And while we would intuitively agree that such a development would appear to be a positive, a historical study of similar reversals on the S&P 500 does not support such bullishness.
Specifically, we identified all historical reversals that exhibited the following conditions, similar to yesterday’s reversal:
- An intraday drop of at least -1% below the previous day’s close
- The intraday drop reached at least a 1-month low
- A reversal to close above the previous day’s close
Since 1950, we found 121 similar reversals in the S&P 500. The index’s returns following these reversals are remarkable in their unremarkability. The median returns from 1 day to 3 months are amazingly in line with median returns following all days.

These results don’t mean that this pattern cannot lead to a reversal (indeed, judging by the futures this morning, this may be one of those times). Additionally, this pattern may lead to more consistently positive results in individual stocks or other securities. However, strictly on the historical evidence, they have led to typical returns on the S&P 500.
Many of our posts lately have covered market developments that led to extreme binary results, i.e., either very positive or very negative returns. This study shows that there is no historical significance to similar reversals to the one we saw yesterday in the S&P 500. Sometimes it is just as valuable to know what not to focus on.


