Hong Kong stocks emerging again after major breakout

Continuing our series on international stock market breakouts, today we feature the Hong Kong Hang Seng. FYI, we did not plan this series, we simply go where the opportunity is – and there is a whole lot of it internationally at the moment. This includes the Hang Seng which has recently broken above a triple top that was formed precisely at a key resistance level.

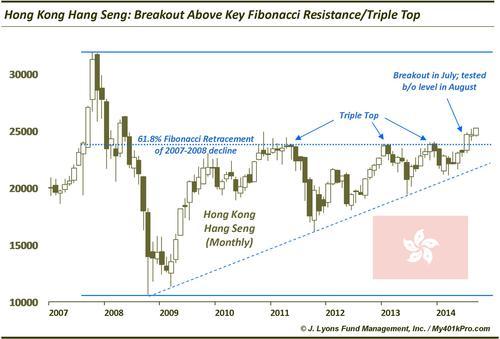
If you’ve read a lot of charting books or blogs, you may have come across the idea of using multiple time frames as an aid in clarifying analysis. It is solid advice and the Hang Seng chart is a good example of this. When looking at the daily or even weekly chart on the Hang Seng, we see a fair bit of “noise” or whippy price action from 2010 to 2014 in the vicinity of the recent breakout level. However, when we “zoom out” to a monthly view, the key resistance level becomes clear.
The important 61.8% Fibonacci Retracement of the decline from 2007 to 2008 lies at 23,829. The importance of that level has been reinforced by the fact that the highest monthly closes since the 2008 low each occurred within a half a percent of that level at 23,721 in April 2011, 23,730 in January 2013 and 23,881 in November 2013. By viewing the chart on a monthly scale, it becomes clear that the 23,800-900 level is the definitive level to overcome in order to confirm a breakout.
Accordingly, the Hang Seng broke out in July when it closed at 24,757. In August (we would have liked to have published a post but didn’t get the chance), it pulled back to test the breakout level, bouncing immediately from the level. A close below that breakout level now becomes a natural stop loss point for longs.
What sort of upside potential does the Hang Seng have given this breakout? To reiterate what we’ve said before, we are not big proponents of price “targets”, except in the case of a short-term trade within a defined range. We’d rather just follow the trend as long and as far as it goes. That said, for a general idea of the potential, various chart analyses yield the following “targets”:
- 161.8% Fibonacci Extension of 2010-2011 decline: ~31,000
- 61.8% Fibonacci Projection from 2008-2010 rally: ~33,000
- 2011-2014 Ascending Triangle breakout: ~32,000
- 2008-2014 Ascending Triangle breakout: ~38,000
Some possible areas of resistance include:
- 78.6% Fibonacci Retracement of 2007-2008 decline: ~27,500
- All-time high: ~32,000
Sometimes using a different time frame can clarify one’s analysis of a stock or index. By zooming out to a monthly time frame on the Hong Kong Hang Seng, we can see that it broke out above a clearly defined resistance level consisting of the 61.8% Fibonacci Retracement level of the 2007-2008 decline as well as a triple top of monthly closes from 2010 to 2013. Though it may not happen immediately, given the breakout, a move back towards the all-time high around 32,000, or 28% from current levels, would not be surprising.
________
More from Dana Lyons, JLFMI and My401kPro.
Sunrise over Hong Kong photo by slack12.

