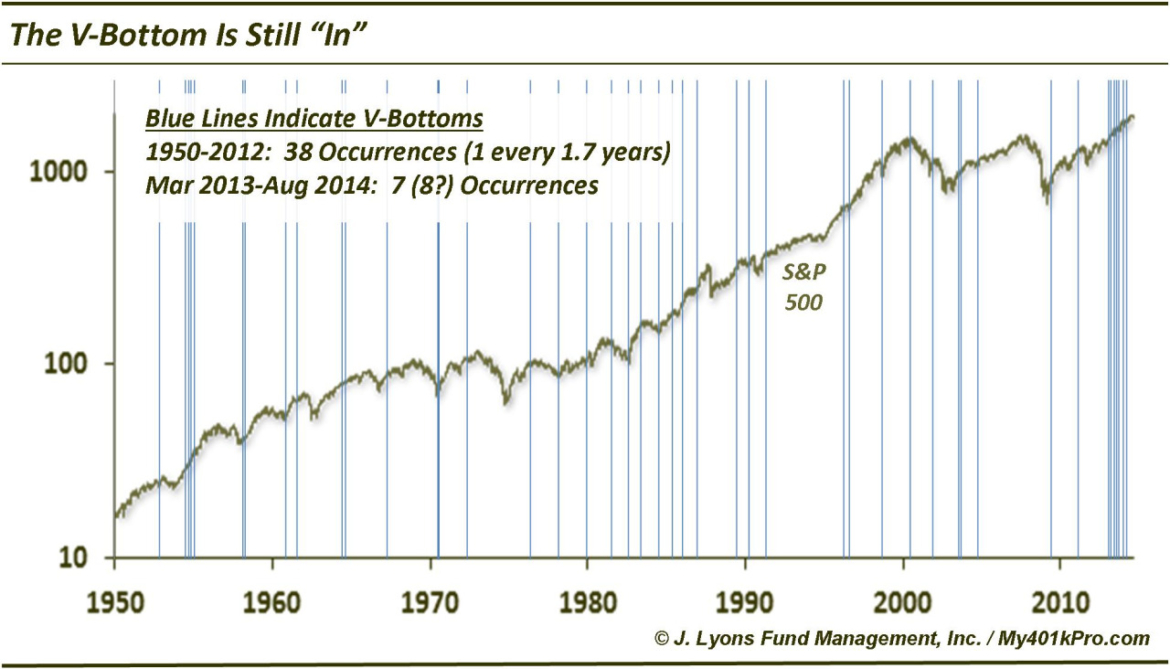
The V-Bottom Is Still In Fashion
Back in February, we posted a chart on a new fad that was all the rage on Wall Street: the V-Bottom. It had nothing to do with hemlines but rather the style in which the stock market had recently come to fashion its lows. Well, we’re several style seasons removed from then but based on recent market action, it appears the V-Bottom is still in fashion.
What do we mean by a V-Bottom? Traditionally, market bottoms have been formed via the “retest” structure. That is, they form an initial low, bounce temporarily, then revisit – or retest – the initial low before rebounding on a sustainable basis. On the other hand, a V-Bottom, refers to an event in which the market sells off, then abruptly turns on a dime and rallies immediately back to its high. Whether due to increasingly eager dip-buyers or perhaps algo-driven, this phenomenon has become increasingly common over the past 18 months, at least according to our criteria.
What is that criteria? Well, in order to identify something, it must be defined. Certainly, defining V-Bottom criteria is a subjective undertaking but we attempted to do so in a manner that captured the V-Bottom phenomenon we’ve been observing but that wasn’t so narrow it wouldn’t detect historical variations of the pattern. This is what we came up with (using the S&P 500):
- A 52-week high
- At least a 3% decline to at least a 1-month low
- A subsequent rally to within 1% of the previous high consisting of A) at least 8 up days out of 10 with B) no -1% down days
Under such criteria, the S&P 500 formed 38 V-Bottoms from 1950 through 2012. That equates to roughly 1 every 1.7 years. Yet, since just March of 2013, there have been no less than 7 V-Bottoms, and probably 8 barring a total collapse today! I’m not sure what the odds are of that occurring randomly given the previous 63 years, but they’re pretty steep.
So what’s the point of this observation other than mere triviality? Given the prevalence of V-Bottoms far out of line with the historical norm, there is something unmistkenly different about the current environment. Unless one is strictly a buy-and-hold investor, it pays to recognize the shifting nuances of the micro-trading environment. For example, a couple weeks ago, we presented a study based on the character of the sell off at the time. The study identified 12 similar instances in history and, without fail, each of the 12 led to further weakness. However, the last occurrence was in 2012, before the onset of the current “V-Bottom” environment. At the very least, that fact gave us pause when considering whether to become overly aggressive in expecting more selling pressure.
Indeed, the market has shot straight up since as the “V” is apparently still in.


