ChOTD-6/6/14 Why The Recent High DOESN’T Quite *LOOK* Like A Fitting Top: Wilshire 5000 Edition
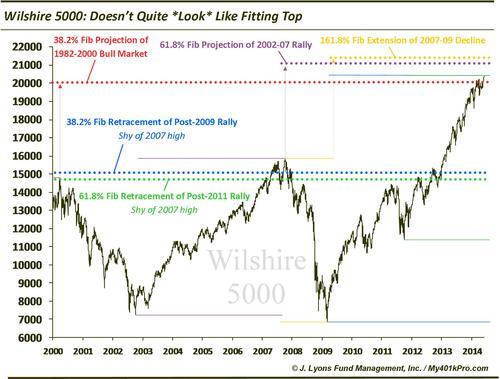
One level the Wilshire 5000 did tag at recent highs was a key Fibonacci projection level:
-
23.6% Fibonacci Projection of the 1982-2000 secular bull market
However, the other analyses on the chart suggest a bit more upside before a “fitting-looking” top level is reached. For example:
-
61.8% Fibonacci Projection of the 2002-2007 rally sits about 5% above recent highs
-
161.8% Fibonacci Extension of the 2007-2009 decline sits about 7% above recent highs
Additionally, looking at the placement of key Fibonacci Retracement support levels based off of recent highs suggests moderate upside still. This is sort of like reverse-engineering where an approximate top may form. For example, given the level of the recent high in the S&P 500, future key retracement support sits below the 2007 high and 2013 breakout area:
-
38.2% Fibonacci Retracement of the post-2009 rally sits about 5% below the 2007 highs/2013 breakout level
-
61.8% Fibonacci Retracement of the post-2011 rally sits about 7% below the 2007 highs/2013 breakout level
While markets do not always top at “logical” levels, and more often than not don’t, the levels we’ve identified usually carry at least temporary significance. The fact that they all roughly line up with each other amplifies the significance, at least theoretically. Should the Wilshire 5000 rally about 5-7% higher, these levels will come into play.