More signs of extreme fear in the options market…maybe
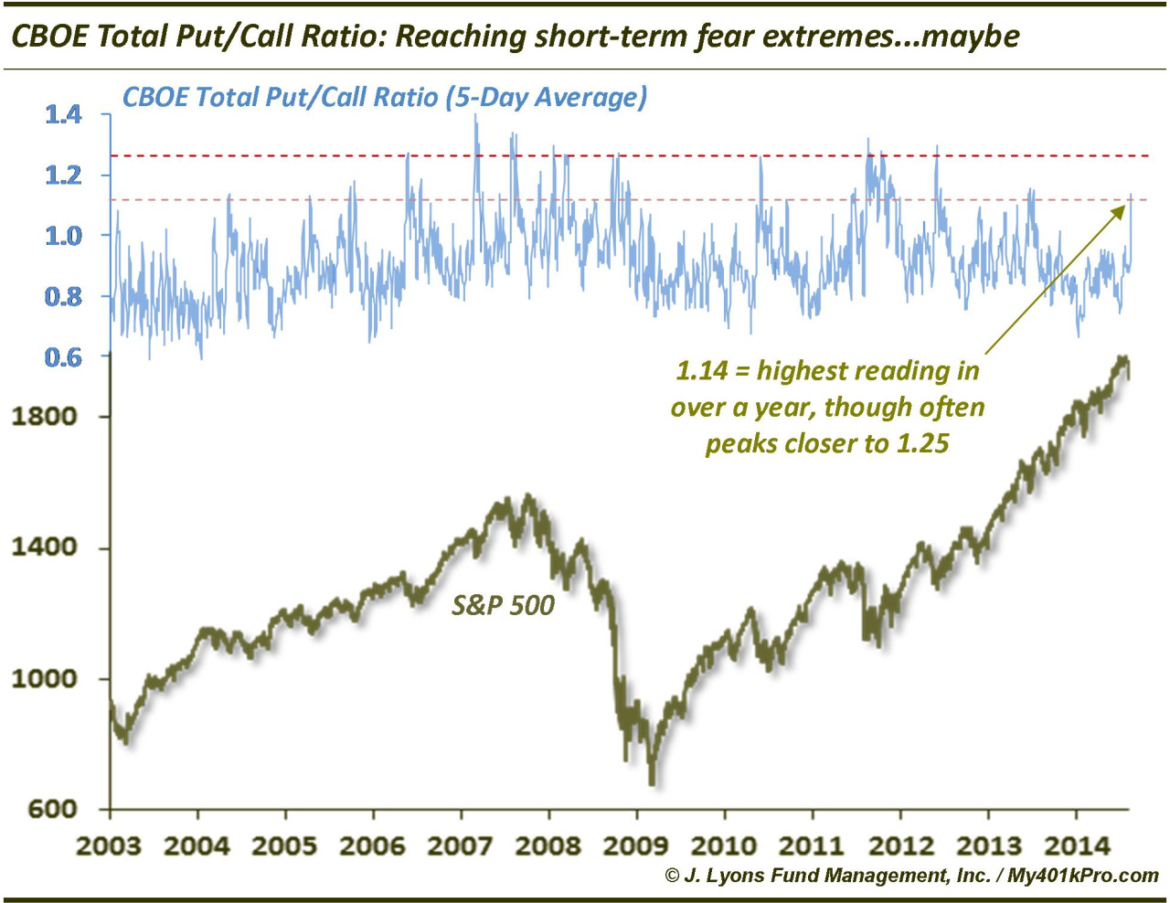
On Monday, we noted Friday’s all-time low reading in the ISE Equity Call/Put Ratio as an indication of fear present in the equity options market. Additionally, Friday saw the highest CBOE Equity Put/Call reading since the August 2011 stock market panic. We can now add another potential piece to the growing inventory of fear readings from the options market: the CBOE Total Put/Call Ratio. The Total Put/Call Ratio includes index options as well as individual equities. Yesterday, the 5-day moving average of the Total Put/Call Ratio hit 1.14, the highest level since the market low in June of 2013.
I say “potential” piece because while the 1.1 area has generally been where the 5-day average has peaked over the past 2 years (and from 2003-2005), it regularly peaked closer to the 1.25 area between 2006 to early 2012. Takeaway: if the staid, upward-drifting market that has been in place for the past 2 years is still intact, this indicator may very well be “high enough” to satisfy market bottoming conditions. However, if the environment is changing, it may pay to wait for the indicator to reach the upper bound of around 1.25 before getting too optimistic about an intermediate-term low in stocks, i.e., weeks to months. Our analysis would lean towards the latter “changing environment” scenario.


