90% Down Volume Days Have Been Good Buy Signals…With One Catch
The concept of a 90% Down Day was introduced, or at least popularized, by Lowry’s Research a number of years ago. As I understand it, such days are characterized by at least 90% of issues closing lower on a given day as well as 90% of volume occurring in declining stocks on that day. Historically, 90% Down Days often mark an exhaustion or capitulation of selling pressure and occur at, or quickly lead to, short or intermediate-term bottoms.
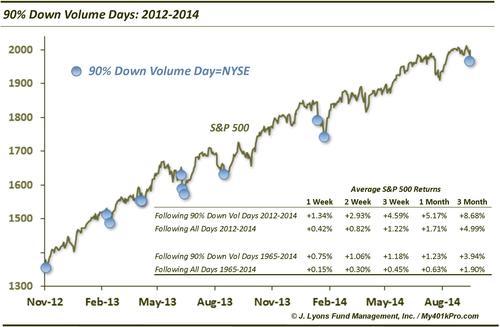
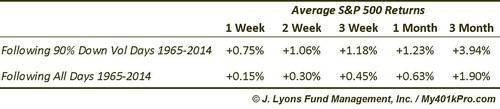
Today’s Chart Of The Day looks at days with 90% of volume on the NYSE occurring in declining stocks, as we saw yesterday. In general, they have led to significant outperformance by stocks over the short to intermediate-term. This table illustrates the outperformance by the S&P 500 following such days since 1965.
Since the November 2012 low which marked the start of the current low-volatility, straight up move in the S&P 500, results have been even better, naturally. This is true even relative to the overall positive environment.
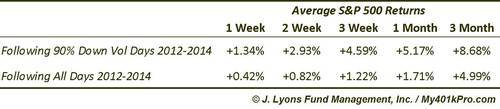
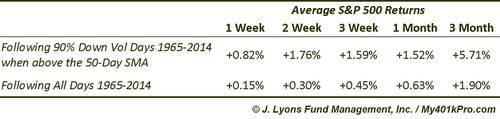
It stands to reason that the returns following 90% Down Volume Days over the past 2 years would be exceptionally positive, given the rally in the stock market. In order to isolate historical periods that may be similar to this one, we also tallied results for 90% Down Volume Days since 1965 that occurred when the S&P 500 was above its 50-Day Simple Moving Average. Returns since 1965 were even more positive than normal.
So is there any catch? Well, the theory behind the 90% Down Day indicator is to identify potential points of exhaustion or capitulation of selling. That is, points at which selling has become so overdone that there are few sellers left in the market, at least in the short-term. The trouble with that theory as it applies to our current circumstance is that we are just coming off of an all-time high. Given that, how is it possible that selling can be exhausted already, except for the shortest of durations? With that point in mind, we tested all historical 90% Down Volume Days that were initiated from within 1% of a 52-week high. As it turns out, this is indeed the “catch”.
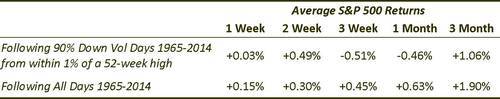
Returns following 90% Down Volume Days beginning from within 1% of a 52-week high have not only been lower than other days following 90% Down Volume Days – they have been lower than average returns following all days! This is quite extraordinary given the outsized returns following 90% Down Days from above the 50-Day SMA, a category which includes this data set. Since 1965, of the 16 occurrences starting from within 1% of a 52-week high, 7 have led to a negative return 1 month later and the average 1-month return following all 16 has been negative.
So overall, particularly in the past 2 years, returns following 90% Down Volume days have been exceptionally positive. The only caveat is that those occurring from within 1% of a 52-week high, like yesterday’s did, have actually led to subpar returns. It will be interesting to see which tendency exerts the most pressure this time.
________
More from Dana Lyons, JLFMI and My401kPro.


