90% Down Days In December Have Been Gifts For Investors
We have explored the phenomenon of “90% Down Volume Days” on a number of occasions this year. To refresh, these are days in which 90% of market volume during the day occurred in declining stocks. One theory suggests that these negatively skewed days are indicative of exhaustive selling pressure, and thus should lead to a rebound. In a September 26 post, we found evidence to back up those claims. And in an October 10 post, we found it was particularly true when we saw multiple 90% Down Days within close proximity. Yesterday (December 10), we witnessed a 90% Down Volume Day on the NYSE.
In light of the approaching year-end, and amid all the Santa Claus Rally talk, we took a look at 90% Down Days occurring in the month of December. Yesterday, we posted that December VIX spikes have led to year-end rallies without exception. We were curious whether December 90% Down Days have had a similar effect. They have.
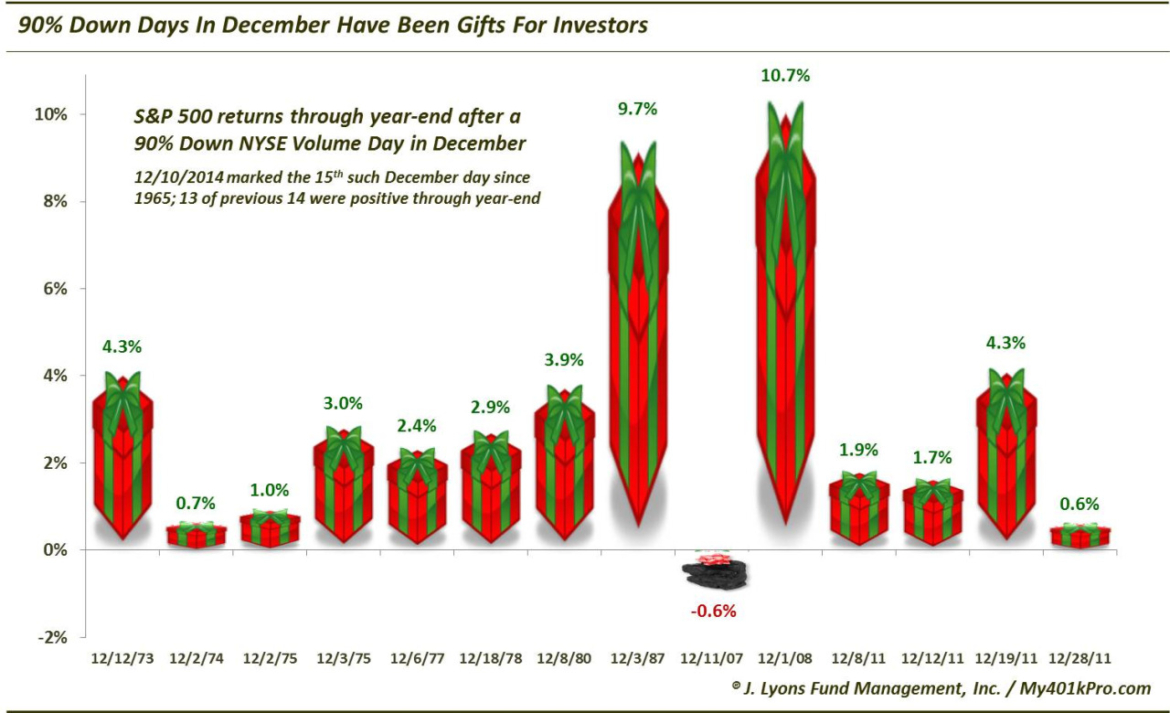
Since 1965, there have been 14 90% Down Days occurring in the month of December. Here is the performance of the S&P 500 into year-end:
- 13 of the 14 occurrences have been positive.
- The 1 negative result, following 12/11/2007, was down just -0.6%.
- The average return into year-end was +3.31%.
- The median return into year-end was +2.65%.
- After year-end, the strength typically persisted with a median 3-month return of +11.5%, nearly triple the return following all 90% Down Days.
Of course, the sooner that the 90% Down Day occurs into December, the more time there is to generate higher returns. The 10th of the month leaves plenty of time for a rally (indeed, the market looks primed today for a head-start on year-end gains). And incidentally, the December 90% Days actually occurred, on average, 10 days into the month. In a testament to historical year-end strength, only one of the dates occurred after the 18th (12/28/2011).
For those wondering about possible overlap from yesterday’s post on the perfect 52 for 52 record of December VIX spikes leading to year-end rallies, there is almost none. The singular common date between the two studies is December 1, 2008. Therefore, the results of yesterday’s 52 December dates and today’s 14 December dates are almost mutually exclusive. In our view, that makes the results even more compelling.
What is a possible catch? It certainly could be argued that the December 11, 2007 occurrence that produced the only loss most closely resembles the present case, in terms of the proximity in the market cycle. However, there is no way to know for sure. And even if it is so, a 2-week performance is short-term enough that there need not be any similarity at all, even if the longer-term situation is alike.
We will note that the one mitigating factor to the 90% Down Days that we noted in the September 26 post was when they occurred from within 1% of a 52-week high, as was the case yesterday. The idea is that the selling in those such examples cannot be substantially considered “exhaustive” as the decline had just begun. In those instances, the average returns over the following 3 weeks to 3 months were actually lower than the average after all days.
Thus, the proximity of the market to its all-time high preceding yesterday’s 90% Down Volume Day may lessen somewhat our confidence in the signal. However, we would still favor its overall historical track record of delivering gifts to investors in the way of a year-end rally.
________
More from Dana Lyons, JLFMI and My401kPro.


