Yesterday’s 90% Down Day Half-Full Or Half-Empty?

We’ve written a few posts about 90% Volume Days in the past. As a refresher, we are referring to days when at least 90% of the volume on an exchange occurs in either advancing issues (“90% Up Days”) or declining issues (“90% Down Days”). While there are exceptions, some of which we have discussed before, 90% days often mark a short-term exhaustion or capitulatory move in that direction of the market, i.e., a 90% Down Day often marks a selling stampede in which traders have capitulated. After such moves, the market often finds at least a short to intermediate-term turning point – a bottom after 90% Down Days and a top after 90% Up Days.
This post takes a look at 90% Down Days from a few unique angles, given yesterday’s 250th occurrence since 1970. As the title suggests, there is good and bad news within the various angles, at least from a historical perspective. So the glass may be half full or half empty depending on one’s perspective. First, here are the S&P 500 returns following the prior 249.
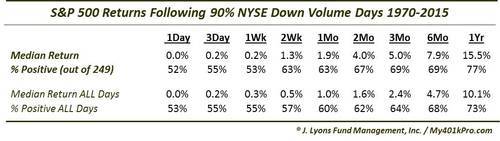
As you can see, returns across all times periods have been better than typical following 90% Down Days. One of the unique characteristics of yesterday’s 90% Down Day was that it actually was accompanied by a greater number of New 52-Week Highs on the NYSE than the day before, although many of the issues were “bond type” issues. Be that as it may, this was a rather unusual development. Looking at the 249 total 90% Down Days back to 1970, it was just the 31st time that has happened. Median returns going forward happened to be better than those following all 90% Down Days.
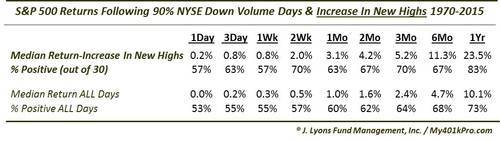
Score one for the “glass half-full” side of the ledger. By the way, yesterday’s increase in New Highs was actually the 2nd largest of any of the 90% Down Days. At an increase of 48 New Highs over Tuesday’s total, yesterday trailed only 2/25/2013’s increase of 49 New Highs. Of the 30 90% Down Days that saw an increase in New Highs, only 7 of the now 31 saw at least an increase of 10 New Highs. Those, incidentally, saw better forward returns than the times that the increase was fewer than 10.
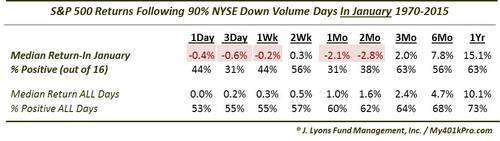
Now for the “glass half-empty” side. Last month, we looked at 90% Down Days occurring within the month of December. We found an almost unanimous tendency for the market to rally, at least into the end of the year, following such days. It has not been as positive a signal in January, however, at least in the intermediate-term. The previous 16 90% Down Days occurring in January actually led to median losses of at least -2.1% 1 month and 2 months later.
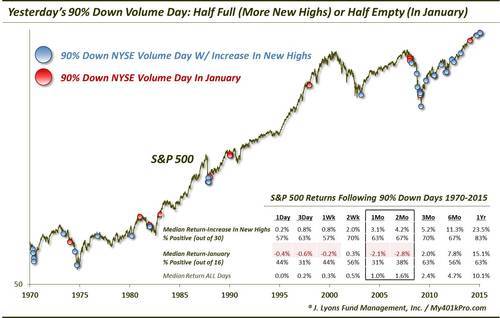
Here is a chart showing the instances of 90% Down Days since 1970 occurring with an increase in New Highs and those occurring in January.
One last unique aspect to yesterday’s 90% Down Day is that it occurred after a gap UP opening. Using the S&P 500 SPDR ETF (SPY) as a gauge (the historical opening gap data is more reliable than the S&P 500), this was just the 20th gap up out of the 159 90% Down Days since the SPY was launched in 1993. And the SPY’s gap up of .71% was the 6th largest of those 20 gaps. Looking at the historical returns following such days, there appears to be a split between those gaps of over and under 0.5%. Unfortunately, the gaps up of over 0.5% happen to be the “glass half-empty” category.
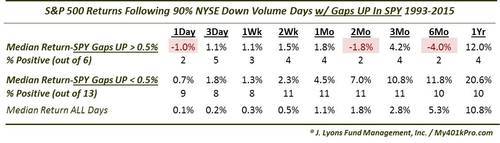
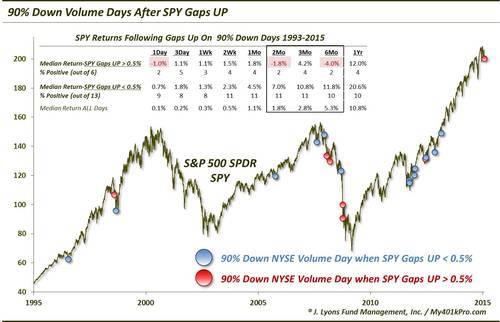
Tthe smaller SPY gaps of less than 0.5% actually led to better returns than even the typical post-90% Down Days. However, the larger gaps up, like yesterday, have had a tendency to underperform, even showing median losses on a 2-month and 6-month basis. The saving grace is that there have been just 6 other instances so there isn’t much to go on there. However, what there is is not encouraging. Here is a chart of the gap up 90% Down Days.
In yesterday’s post, we talked about “parsing: data results. While we like to avoid data-mining, there is actually good reason to break down the data further at times. Considering the 250 90% Down Days since 1970, there are obviously big differences among the character of the market between them. In this post, we tried to identify some of the traits unique to yesterday’s occurrence. In doing so, we found reasons to be both optimistic and pessimistic regarding the results. Our takeaway would be that the overall 90% Down Day positive influence is relevant, but may be mitigated a bit by some of the negative factors we looked at today. At the end of the day, it may depend on an investor’s view of the market in general – half full or half empty.
________
"The Glass Half Full” photo by Bart.
More from Dana Lyons, JLFMI and My401kPro.


