Is The Stock Selloff Over — Or Just Beginning?

“90% Down Days” often mark a selling climax…but occasionally ignite a much larger decline.
“Is this to end or just begin?” – All My Love by Led Zeppelin
As risk managers, one of the challenges is to determine whether a market pullback is just a minor dip or a precursor to a larger decline. The correct interpretation determines the appropriateness of “buying the dip” versus selling into the weakness in order to prevent bigger losses (for you traders and investors whose stock market experience began sometime in the past 2.5 years, no, buying the dip is not always the appropriate choice). Monday’s steep selloff presented money managers with such a determination to make. And one interesting aspect of the decline that may be helpful in making that determination was Monday’s qualification as a “90% Down Day”. That is the focus of this post.
There are a few different definitions, but typically a “90% Down Day” refers to a day in which at least 90% of all volume on an exchange (i.e., NYSE, Nasdaq, etc.) during the day occurred in declining issues. It may not seem like it would be an unusual occurrence but it is actually fairly rare. Over the past 50 years, there have been 267 such days on the NYSE (our preferred gauge), or about 5 per year. The frequency of these events has picked up considerably over the past several years (key word being frequency, as in high frequency trading?). Before Monday’s instance, exactly half of all 266 occurrences in 50 years took place since the cyclical market top in July 2007.
So what’s the big deal about 90% Down Days? They have long been considered indicators of a selling climax, capitulation, exhaustion. etc. That is, the selling on 90% Down Days is so excessive that it indicates some level of fear or panic. And excessive levels of fear or panic are what produce market bottoms. The theory’s historical track record has evidence to back up the notion of the 90% level holding some significance. More often than not, these days have accurately signaled at least an approaching low, if not the precise low. Therefore, market returns following these days have, in general, been better than average.
Back in September we took a look at this 90% Down Day phenomenon from a few different angles. Today’s post mirrors that one – with a few different twists – and reaches the same general conclusions. Let’s take a peek at some charts and statistics.
One of the unique aspects of Monday’s market rout was that not only was the NYSE down volume greater than 90%, the number of declining issues (breadth) was as well. This has been even rarer, occurring only 57 other times since 1965.
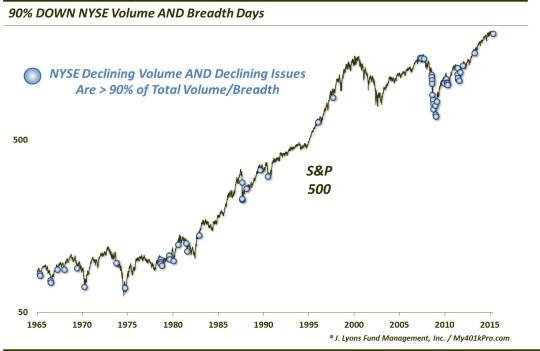
On the chart, one can easily see the increase in occurrences since 2007. And one might argue that, of course during the financial crisis, there was an abundance of them. However, note the absolute dearth in occurrences in the 2000-2002 decline. So something has changed in the past 8 years (looking at you HFT).
So how were the returns? As we mentioned, returns following such panic days have generally
been above average. In fact, average S&P 500 returns following these 90% down volume AND breadth days have more than doubled the long-term average on all time frames.
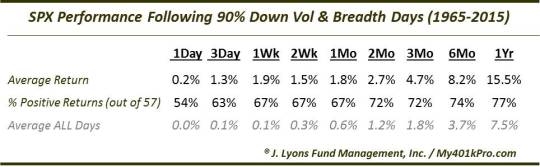
The attractive returns are, again, thanks to many occurrences near market bottoms of some significance. Although, most occurrences did not mark the final low for the selloff. Just 16 of the 57 prior occurrences saw the market bottom on the 90% Down Day and not look back.
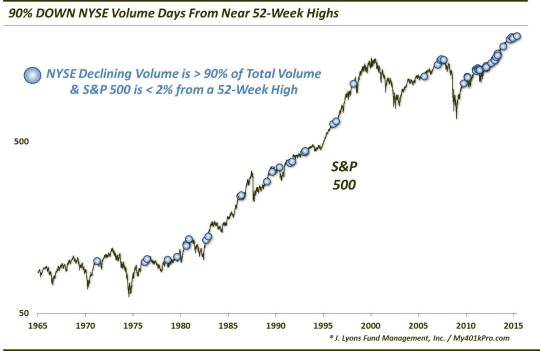
That said, all is not rosy here. We mentioned in the post last September that incidents of 90% Down Days occurring near the stock market’s 52-week high were less reliable as selloff climaxes. The notion is that, how could there be a selling “climax” when the market is still so close to its highs? From among this sample come many of those occurrences we referenced early in the post that led to more significant declines rather than a meaningful market bottom. These occurrences seemed to be perhaps indicative of a changing market regime rather than capitulation. Thus, they signified the beginning of the selling, not the ending.
Specifically, here is what we are looking at. Since 1965, there have been 50 90% Down Volume Days (or one per year) occurring when the S&P 500 closed the prior day less than 2% from its 52-week high. The S&P 500 closed last Friday 1.34% away from its 52-week high, thus qualifying.
While the average returns following these days are not catastrophic, they are materially worse that the first sample. The average 1-month return following incidents in the past 50 years is actually negative. And before the barrage of occurrences starting in 2012 (evident on the chart), the average returns were negative out to 3 months.
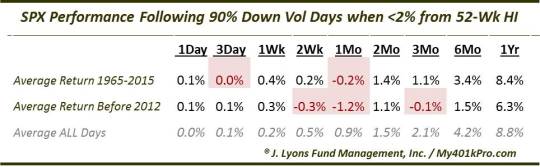
The culprits here are the several occurrences that took place very near to key intermediate to long-term tops – and perhaps kick-started the subsequent bear markets. These include dates in 1971, 1976, 1978, 1981, 1990, 1998, 2007 and 2011. Therefore, these 90% Down Days do not always signify the exhaustion of selling. Sometimes they signify the beginning of a longer-term negative market regime.
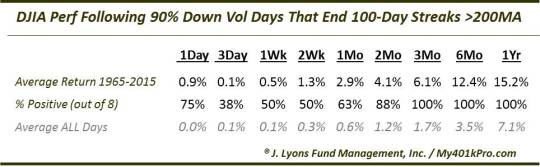
One final angle we looked at with regard to 90% Down Days has to do with a specific development in the Dow Jones Industrial Average that took place on Monday. After 170 consecutive days above its 200-day simple moving average, the DJIA closed below it. Since 1965, there have been just 8 other days on which the DJIA ended a streak of at least 100 days above its 200-day moving average on the same day as a 90% Down Day. They have all taken place since 1990.
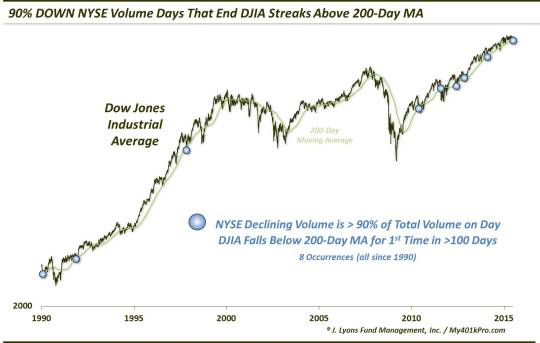
While market returns following the previous study had a negative bent to it, this one does not…despite the significance some place on the breaking of the 200-day moving average. Consider this: from 3 months to 1 year following these events, all 8 of the prior instances saw the DJIA trading higher. Furthermore, the average returns were 2-4 times the normal historical returns.
So did Monday’s 90% Down Day mark a capitulation and potential end to the (very) recent selling? Or did it signify the onset of a much larger developing market decline? Obviously, we can’t know for sure. The majority of these 90% Down Days historically have led to an impending market low and above average returns going forward. However, there has been a significant number of these days that occurred near important market tops, leading to more serious losses to come. And while that criteria has not been a guaranteed harbinger of serious losses, Monday’s circumstances do fit that bill.
So, we don’t know if Monday marked the end of the near-term selling or the start of longer-term selling. At least, hopefully, the increased volatility will spur the market in one direction or the other – instead of following the 1st half of the year that had the S&P 500 running in circles to a 0.20% return.
_____________
“Finish/Start” photo by Anne.
More from Dana Lyons, JLFMI and My401kPro.
The commentary included in this blog is provided for informational purposes only. It does not constitute a recommendation to invest in any specific investment product or service. Proper due diligence should be performed before investing in any investment vehicle. There is a risk of loss involved in all investments.


