Light At The End Of The Tunnel For Stocks…Or A Train?

So much for summer trading. Global markets are getting more interesting by the day. Last week, we wrote a post examining the phenomenon of 90% Down Days. Again, these are days in which at least 90% of volume on the NYSE occurred in declining stocks. Such days have often been signs of selling exhaustion and have often led to intermediate-term rallies.
And if there has historically been anything more positive in the intermediate-term for stocks than a 90% Down Day, it’s been multiple 90% Down Days.
Thus, despite the ongoing selloff in stocks, the potentially good news is that today produced another 90% Down Volume Day on the NYSE.
One “catch” as we pointed out last week was that 90% Down Days occurring while the S&P 500 was in close proximity to its 52-week high did not produce results as favorable as the larger sample. In fact, on several occasions, it marked the beginning of the end for cyclical or intermediate-term bull markets. Does the same hold true regarding multiple 90% down days? Let’s take a look.
Here is a chart showing the occurrences of multiple 90% NYSE Down Volume Days within 2 weeks of each other since 1965.
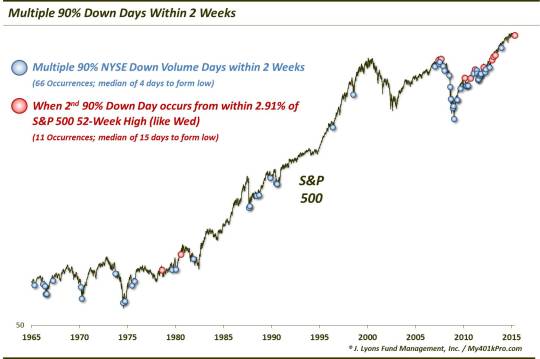
The blue dots represent instances of 2 90% Down Volume Days occurring on the NYSE within 2 weeks (there were several periods that saw more than 2 instances within that time frame; however, we only include the 2nd occurrence on the chart.) From a mere glance, it is easy to see that many of the instances occurred at or near market bottoms of some significance. Going forward, average returns were much better than typical.
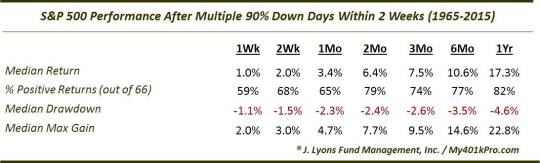
Median returns were consistently 2-3 times as large as returns following all days, with nearly 70% of occurrences showing gains 2 weeks later and 80% 2 months later. Furthermore, the median Max Gain has outweighed the median Drawdown by a 2:1 margin in the short-term, expanding to 5:1 in the longer-term. And among these 66 instances, it took a median of just 4 days to put in a sustainable intermediate-term market bottom.
Back to the “catch”. The red dots on the chart represent occurrences where the 2nd 90% Down Day was initiated with the S&P 500 trading within 2.91% of its 52-week high (as was the case yesterday). The results following these 11 occurrences have not been quite as positive.
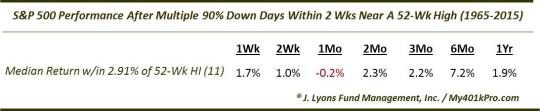
As the table shows, the median 1-month return following these circumstances has actually been negative. And the median 1-year return was just 1.9%. The occurrences have taken a median of 15 days to form an intermediate-term low, i.e., 3 more weeks of selling. These results indicate that these bouts of heavy selling, while at times leading to a bounce in the intermediate-term, have occasionally kicked off significant cyclical declines, such as in 1980 and 2007 and short-term but significant declines like the 2010 Flash Crash and 2011 crisis.
This may, theoretically, be as a result of a break in momentum and a change in psychology from “buy mode” to “sell mode” on the part of the greater investment community. Such a sea change can have a profound impact on a market near its highs and vulnerable to mean-reversion lower. It can be especially impactful if it is accompanied by a rush to unwind excessive leverage or margin debt built up in the system. I’m not saying that is what is happening now, but a psychological shift can escalate in a hurry in an over-leveraged market (looking at you, China).
Another interesting thing that jumps out on the chart is the frequency with which these clusters have occurred since 2009. This observation lends evidence to the fact that we have been in an all-or-nothing, risk-on, risk-off type of environment in recent years – at least much more so than is historically normal. Of course, the results following this phenomenon since 2012 have been nearly flawless, thanks to the V-Bottom, BTD market that has prevailed.
In summary, despite the ongoing (at times, severe) weakness in the stock market, there may be a light at the end of the tunnel for investors.
If history holds true to form (especially very recent history), given the occurrence of multiple 90% Down Days over the past few weeks, the market should bounce within a few days. That said, given the excessive leverage and margin debt committed to this market, there is a risk that this heavy selling can potentially contribute to a shift in investor psychology, like that unfolding in China. In that case, the decline can actually lead to an escalation of the selling, rather than an exhaustion. Thus, while perhaps the odds are against it, we cannot dismiss the possibility that the light in the tunnel is actually a train.
________
“Light at the end of the tunnel” photo by John McCullough.
More from Dana Lyons, JLFMI and My401kPro.
The commentary included in this blog is provided for informational purposes only. It does not constitute a recommendation to invest in any specific investment product or service. Proper due diligence should be performed before investing in any investment vehicle. There is a risk of loss involved in all investments.


