Broad Stock Market Index At “Must Hold” Level

The NYSE Composite’s bull market is on very thin ice.
Wow, what a first week of the year in the markets. At least for the bears, that is. It’s looking like potentially the worst first week in U.S. stock market history, in fact. We’ll try to check into that and hopefully get a post up about where it ranks and what the potential ramifications are based on historical near precedents. We can tell you that there are potentially severe longer-term ramifications based on specific developments that took place within the markets this week. First and foremost were price breakdowns among key indices which we highlighted on Wednesday.
And while those breakdowns on Wednesday, in our view, represented the most significant developments of the week, not all major indices have broken corresponding levels. There are others that are close – very close. One such index of major broad market consequence is the NYSE Composite (NYSE). The NYSE is currently on very thin ice in terms of holding a major support level. In fact, the ice may be cracking as we speak.
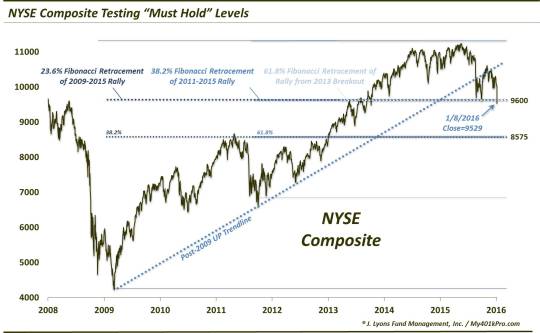
The level we speak of on the NYSE, around 9600, represents a cluster of Fibonacci Retracement lines from the 3 most critical junctures since the 2009 low. We have mentioned often that the closer that key levels match up with each other, the more potential significance there is to the level. At least, it increases our confidence that the level is indeed valid and relevant.
In this case, the specific levels near 9600 are:
• The 23.6% Fibonacci Retracement of the 2009-2015 rally
• The 38.2% Fibonacci Retracement of the 2011-2015 rally, and
• The 61.8% Fibonacci Retracement of the rally from the early 2013 breakout level to the 2015 high
As of today, January 8, the NYSE closed at 9528.77, so it is indeed on thin ice, if not slipping into the frigid waters. While a level of this longer-term magnitude should be given some rope in terms of temporarily overshooting a level, we wouldn’t give it too much rope.
What are the ramifications of losing this level? First off, it opens up the next major downside level around 8575, which is another 10% of risk from here. Additionally, it would set a lower low on the chart. The NYSE has already established a lower high, so this would suggest a downtrend is in the works (and, potentially a bear market).
So what do we think will transpire here? Well, there is no way of knowing and no reason to forecast. As always, follow prices and let them tell you what is happening. While this level represents pretty convincing support, one bad thing for bears is that the NYSE already tested the area, in the August-September bottoming process. Therefore, the level has been softened up a bit already, as we say. That is, the level is less likely to be as strong of support as it was the first time.
Thus, if we had to guess, we would not be surprised to see the level hold again, temporarily, producing a smaller bounce than the post-September version before eventually failing as other indices are doing. But that is just speculation, so don’t “hold” us to it.
________
“Walking On Thin Ice” photo from deviantart.com.
More from Dana Lyons, JLFMI and My401kPro.
The commentary included in this blog is provided for informational purposes only. It does not constitute a recommendation to invest in any specific investment product or service. Proper due diligence should be performed before investing in any investment vehicle. There is a risk of loss involved in all investments.


