Utilities Continue To Follow The Road Map
Utility stocks have been unusually responsive to key chart levels recently.
As money managers who rely quite a bit on the charts, it’s always comforting to work with securities and data series that conform reliably to charting analysis. On the other hand, most chartists can probably think of a handful of tickers that never quite seem to do what they’re “supposed to”. One of my charting nemeses has always been the utility sector, specifically, the Dow Jones Utility Average. For whatever reason, the index has always seemed to zig when I thought it would zag, and vice versa. However, the tables have turned in 2016 as utilities have closely followed the “map” as far as conforming to standard charting practices. Thus, the sector has been pretty good to us this year – and many others, no doubt (though admittedly that fact has me a bit nervous).
One example of the sector’s conformity dealt with its breakout, and subsequent tests, that we noted back in early April. The near textbook breakout launched the utilities on a tear that would cement the sector as the star of the first half of the year. It would be a very different story as the second half began, however, as the utility sector immediately topped out. Again, though, the charts gave us an accurate head’s up of a potential stalling out by the sector.
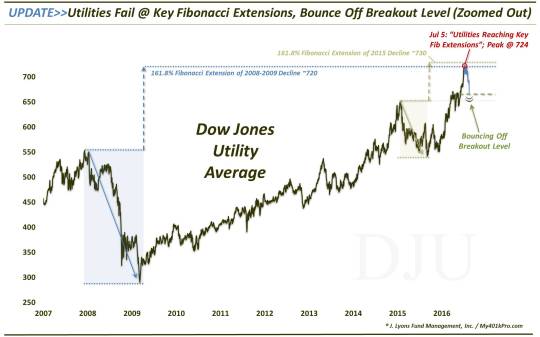
We’ve written many times about Fibonacci analysis in these pages. Once again, it is a mathematical sequence of numbers that appears in all walks of nature and elsewhere, including the markets. On July 5, we posted a chart on Twitter and StockTwits (follow us on both: @JLyonsFundMgmt) showing how the Dow Jones Utility Average was in the vicinity of 2 noteworthy Fibonacci Extensions. These Extensions refer to a magnitude of gain that will often contain prices, based on the size of a correction or trading range from which they have emerged.
For example, the 2 most noteworthy corrections in the Dow Utilities over the past 10 years occurred from 2008-2009 and from January-September 2015. If one calculates 61.8% (i.e., the result of dividing one Fibonacci number by the next in the sequence) of the height of each correction range and adds it to the top of the range, the result is the 161.8% Fibonacci Extension of the range. As it turns out, the 161.8% Extension of the 2008-2009 decline is at approximately 720. Similarly, the 161.8% Extension of the 2015 decline lies at approximately 730.
Thus, when the Dow Utility Average was approaching, or hitting, that vicinity, it was suggested that the rally may at least soon pause for a breather. And indeed, the index would peak on July 6 at 724.
Here’s a closer look at the action of the past year and a half.
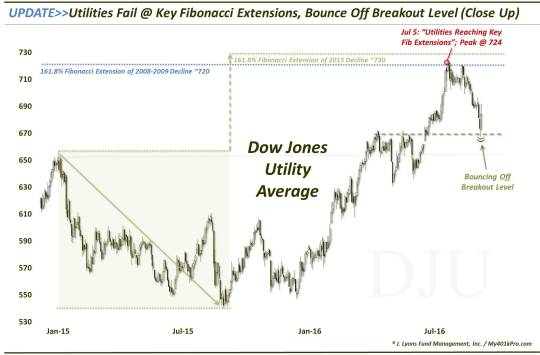
You may notice at the far right of the chart that prices finally did bounce over the past 2 days. The bounce also occurred according to the charting road map. Specifically, the index dropped back to the level from which it broke out (~670) back in early June. And on cue, utility stocks bounced some 3.5% off of Wednesday’s test of the breakout level.
So where does the map go from here…and will utilities continue to follow it? Well, a chart can certainly serve as a fine map, but it is not a crystal ball. As far as adhering to the map, we will continue to play the Dow Utility Average as if it will be respectful of the charting signs along the way, as it has recently.
That means that, as long as the index holds above 670-ish, the road should lead higher. Although, a detour toward the low-650′s level that marked the breakout of the January 2015 highs would not be a shock. On the upside, the index may run into roadblocks in the low-700′s and at the highs around 724. And if the index is going to break out of this recent range, in either direction, it will likely take, as the sign in the photo says, some serious work ahead by the utilities.
_________
More from Dana Lyons, JLFMI and My401kPro.
The commentary included in this blog is provided for informational purposes only. It does not constitute a recommendation to invest in any specific investment product or service. Proper due diligence should be performed before investing in any investment vehicle. There is a risk of loss involved in all investments.