
The Most Important Level In The Stock Market (PREMIUM-UNLOCKED)
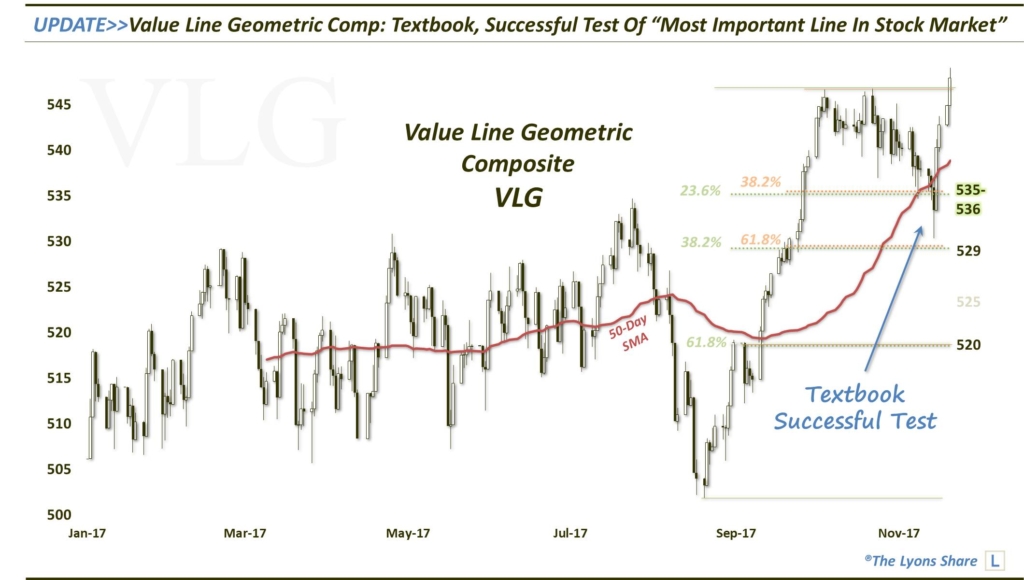
**The following post was originally issued to The Lyons Share members on November 9, 2017. The Value Line Geometric Composite proceeded to undergo a textbook, successful test of “The Most Important Level In The Stock Market” and subsequent bounce to new highs. See the bottom of the post for an updated chart.
The 536 level on the Value Line Geometric would appear to be a clean and clear line in the sand delineating the business as usual “BTD” environment from one that is more vulnerable to a sharper decline.
We are witnessing today about the first bit of adversity in the U.S. equity large-cap space that we have seen since the current rally kicked off in August. As we’ve discussed at length in our Daily Strategy videos, however, as the large-caps have continued to score new highs over the past month, the broader market has been going nowhere — with a slight downward bias. And while today’s 1% drop (a/o now) in the large-cap averages off of all-time highs is hardly cause for alarm, its impact on the broader market is more serious. That’s because the month-long consolidation has left the broader market in a spot where the selling pressure of the past few days has already placed it at an important level of support.
Specifically, our favorite barometer of the broad market — the Value Line Geometric Composite (VLG), which tracks the “median stock performance” — is presently testing a key level near 535-536 associated with its post-August breakout and other significant lines of support, including:
- The July former all-time high
- The 50-Day Simple Moving Average
- The 23.6% Fibonacci Retracement of the August-October rally
- The 38.2% Fibonacci Retracement of the rally off the early-September launch area to the October top
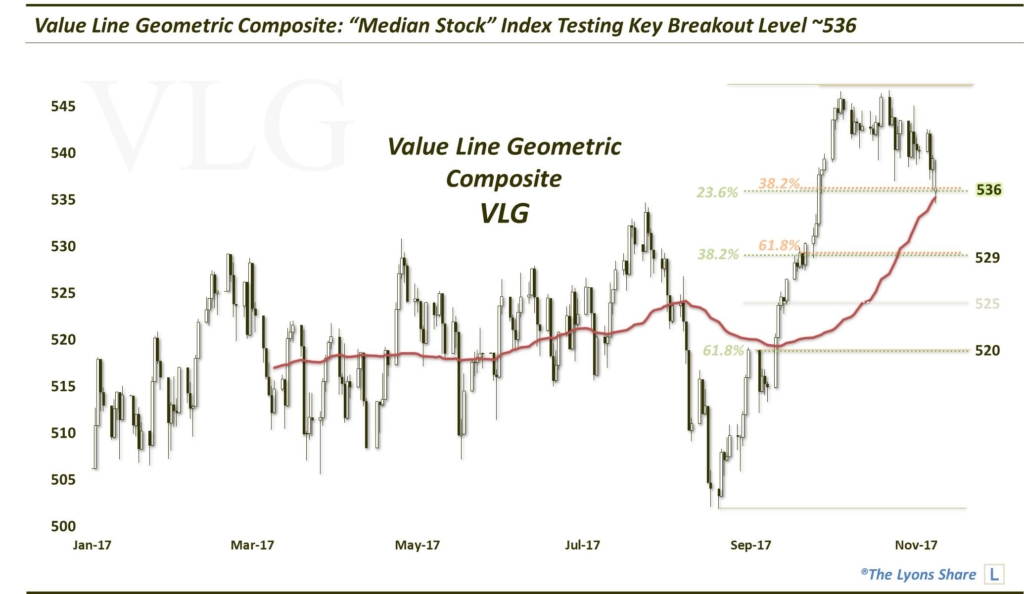
While this level, near 536 in the VLG, isn’t necessarily a make-or-break line for the broader bull market, a break of it would indicate a change in the market’s character, in our view. Up until now, recent investor behavior has focused on “BTD”, or “Buy The Dip”, into any hint of weakness. As such, the impressive confluence of support lines in the 535-536 area should serve as more than enough impetus for stocks to bounce. If they fail to do so, it will be a clue that the climate has changed and that stocks are likely to test deeper levels.
For now, we have dipped our toes into some small-cap exposure based on this VLG test of significant proportions, as well as similar tests in the small-cap space. Again, if BTD still rules the day, we should see a bounce and a resumption of the post-August rally off of this 535-536 level. If BTD is dead, or on hold and 535-536 is broken, expect a further drop in the VLG to 529, then 525 and ultimately 520.
As always, watch the Daily Videos for updates on our strategy here.
**Updated Chart – November 22, 2017:
_____________
Disclaimer: JLFMI’s actual investment decisions are based on our proprietary models. The conclusions based on the study in this letter may or may not be consistent with JLFMI’s actual investment posture at any given time. Additionally, the commentary provided here is for informational purposes only and should not be taken as a recommendation to invest in any specific securities or according to any specific methodologies. Proper due diligence should be performed before investing in any investment vehicle. There is a risk of loss involved in all investments.


1 Comment