Great (Stock) Expectations
Consumers’ expectations for stock market gains have never been higher — or more assured.
Since the August stock market low, bulls have had it pretty good. Rally participation has been excellent, as has price structure for the most part. Outside of a textbook successful test of The Most Important Level In The Stock Market, it has basically been a parade of new all-time highs in the major averages. So with the stock market hitting on all cylinders, there is little reason not to expect more of the same. That may just be the problem, however.
With stocks up sharply since August, not to mention the past 8 years, it should be no surprise that bullish sentiment has followed suit. That’s not necessarily a bad thing. Bullishness is required to attract flow of capital into stocks and, thus, propel the market higher. However, bullishness can eventually become so rampant that there is essentially nobody left to buy stocks — or at least not enough to perpetuate a rally. Identifying those relevant extremes is the tricky part, though.
A case in point can be found in the University of Michigan’s Survey of Consumers. One of the questions asked of respondents in the survey is their estimation of the “probability of an increase in the stock market in the next year”. Among the various ways that the UM breaks down the data is by taking the mean response to that question. We mentioned in a post last month that the most recent reading (August) saw the mean response register in at 62.7%. As we noted, that was the 2nd highest reading in the survey’s history (back to 2002) behind only June 2015, which, of course, occurred near an important intermediate-term top.
We also stated, however, that it “certainly is possible that the survey reading gets more extreme, and that stocks continue to run higher in the meantime.” And, we followed, “if they loved ’em in August, we can’t wait to see the September reading.” Well, given the continued rally in stocks since the end of August, the mean response has indeed gotten more extreme. In fact, the October reading eclipsed the June 2015 record, coming in at an all-time high 64.5%.
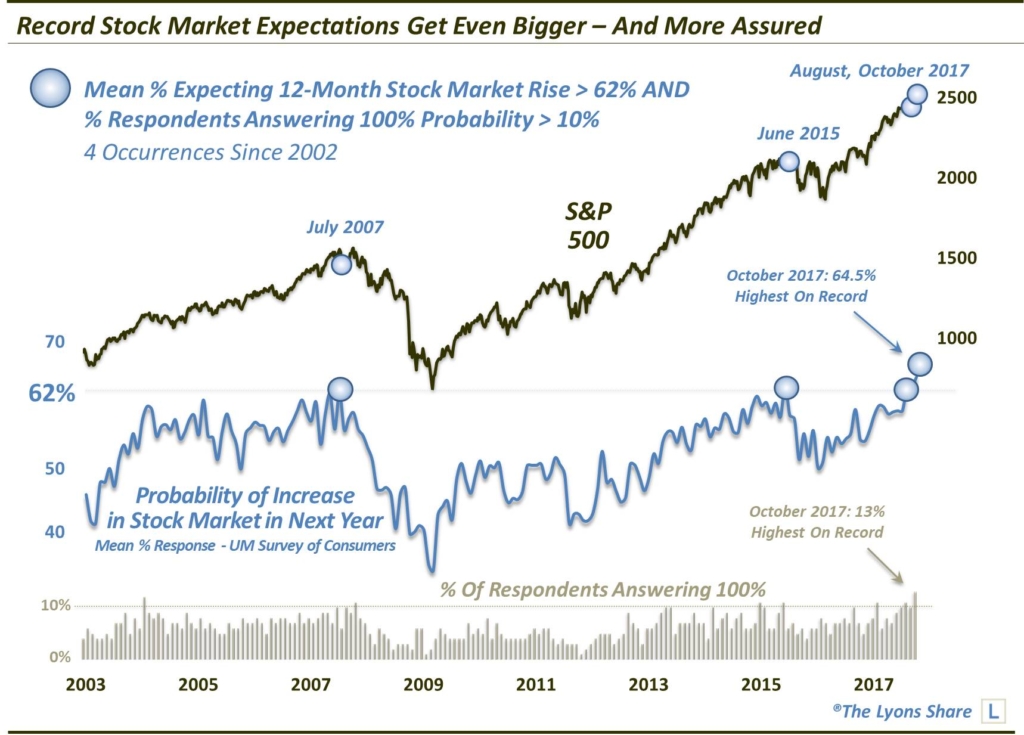
Furthermore, the survey also provides the level of “extreme” responses in addition to the mean. When tallying the survey numbers, the UM breaks the responses down by quartiles (i.e., the % of respondents expressing a probability of a stock market increase between 1%-24%, 25%-49%, etc.). They also provide the percentage of respondents who say there is a 0% chance of a stock market rally over the following year as well as the percentage of respondents saying there is a 100% chance.
As the bottom pane in the chart reveals, in October, the percentage of respondents stating there was a 100% chance the stock market would be higher in 12 months came in at 13%. That was also the highest on record, surpassing the previous high of 12% set in February of 2004, which incidentally marked a 9-month high in the S&P 500.
Again, October’s readings for both the mean and the percentage in the “100% camp” are unprecedented. If we loosen the parameters a bit, we can look for others junctures that saw extremes in both figures. For example, if we search for all months with mean readings above 62% and “100%” readings above 10%, we come up with the following 4 months:
- July 2007
- June 2015
- August 2017
- October 2017
Obviously, the first 2 incidents occurred right near a cyclical top (2007) and a serious intermediate-term top (2015). So the potential existence of unreasonably high expectations is certainly a concern. However, I will note that at the time of the 2007 and 2015 occurrences, our models had already detected meaningful signs of internal market deterioration. So an underlying weakening of the market’s foundation had left it vulnerable to the type of correction that followed in both instances. As yet, we have not seen similar signs of deterioration. Thus, the August and October readings have done nothing to slow down this rally.
When will the market destabilize and become vulnerable to realizing the substantial potential risk represented by these measures of extreme bullishness? We don’t have a crystal ball. We do, however, have our objective, quantitative models that gave us a head’s up at those previous tops. So when we see those signs of deterioration start to pop up again, we’ll know that these great expectations may very well soon turn into false hopes.
If you’re interested in the “all-access” version of our charts and research, please check out The Lyons Share. When we begin to see the signs of deterioration and potential market risk, TLS members will be the first to know. Also, sign up by November 27 and save more than 25% off an Annual Membership in our Thanksgiving/Black Friday Sale. Considering this sale price — and the fact that we may well be entering an investment environment tailor made for our active, risk-managed approach — there has never been a better time to reap the benefits of this service. Thanks for reading!
_____________
Disclaimer: JLFMI’s actual investment decisions are based on our proprietary models. The conclusions based on the study in this letter may or may not be consistent with JLFMI’s actual investment posture at any given time. Additionally, the commentary provided here is for informational purposes only and should not be taken as a recommendation to invest in any specific securities or according to any specific methodologies. Proper due diligence should be performed before investing in any investment vehicle. There is a risk of loss involved in all investments.


