
Bullish Fund Assets Jump Off The Chart
Assets in bullish funds at the Rydex family have soared to uncharted territory — especially relative to dwindling bearish assets.
Given the persistent rally in the U.S. equity market in recent months, one might assume that bullish sentiment extremes have been commonplace as well. But while that may be true of longer-term sentiment measures, shorter-term metrics that we monitor have not necessarily reflected that notion. In fact, it has been a lack of true short-term froth that has us very comfortable in stocks, despite the incessant price ascent. After several strong days to begin 2018, that has finally started to change.
One indication of this newfound, short-term bullish sentiment extreme comes from a look at the level of assets invested in the Guggenheim, formerly “Rydex”, family of mutual funds. To refresh, Rydex was founded to provide active managers with mutual funds, bullish and bearish, that they could trade as often as they like, typically based on their view of the prevailing market risk. Thus, by tracking the assets in the bullish and bearish funds, market observers gained a new metric with which to measure investor sentiment. When bullish assets spiked, especially relative to bearish assets, sentiment was thought be extremely frothy, and vice versa when bearish assets spiked. And, as with typical sentiment measures, contrarian treatment became the best way to approach this data, i.e., sell when bullish assets rose to extremes and buy when bearish assets rose to extremes.
Since the proliferation of ETF’s began about a decade ago, mutual fund assets have steadily declined. It has especially been the case with active “trading” funds such as those offered by Rydex. Because of that, indicators based on the Rydex assets have lost some of their effectiveness. That said, we don’t think the data is completely useless — especially when at extremes. The data is undoubtedly at extremes right now.
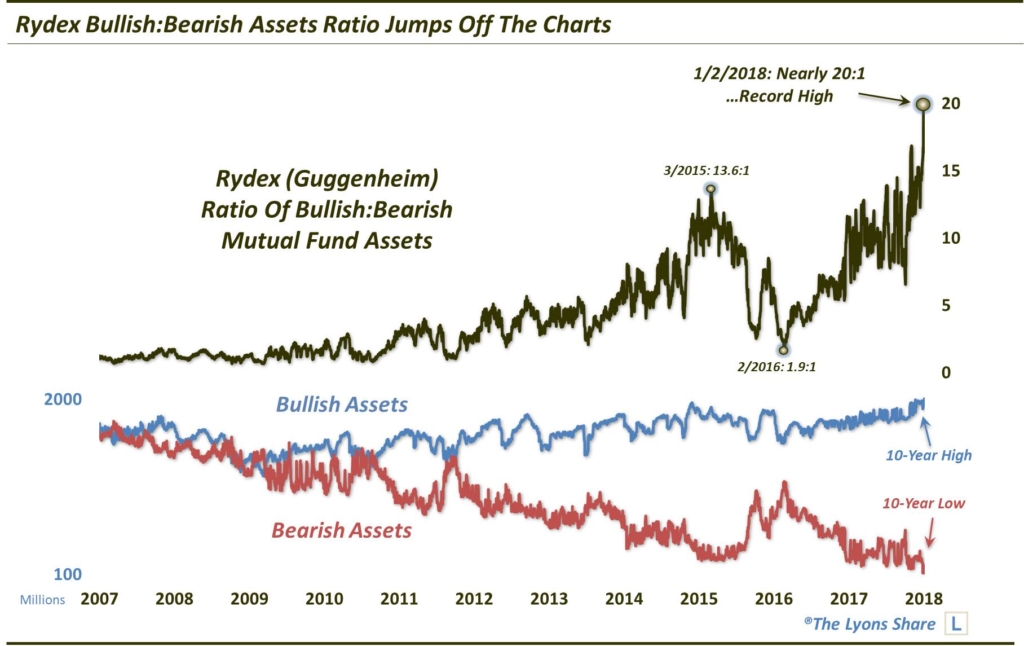
When looking at assets in Rydex’ bullish funds, we see an interesting development in recent days. Despite the overall decline in mutual fund investment, assets in Rydex bull funds have actually risen to at least a 10-year high in recent days. The fact that this rise in assets has bucked the structural decline in mutual fund assets makes the elevated extreme more compelling, in our view (for bullish assets, we are using the most popular leveraged and unleveraged long S&P 500 and Nasdaq 100 funds, which dominate the bullish assets).
Conversely, we see the opposite story when looking at bearish assets at Rydex. Specifically, assets in those funds have dropped to at least a 10-year low. Now, given the structural decline in mutual fund assets, as well as the persistent stock market rally, we should perhaps not be surprised by this development. However, juxtaposed against the elevated bullish assets, we believe this record dearth of bearish assets likely represents a genuine low bearish sentiment extreme (for bearish assets, we are using the most popular leveraged and unleveraged inverse S&P 500, Nasdaq 100 and Russell 2000 funds, which dominate the bearish assets).
We can see that clearly if we combine the two series. That is, if we compare the level of assets in bullish funds to those in bearish funds, we can track just how high bullish sentiment has become — on a relative basis versus bearish sentiment and versus historical levels. It should be no surprise that this Rydex Bull:Bear asset ratio has risen to an extreme. However, the level to which it has risen in recent days is truly off the charts when compared with historical readings.
As the following chart shows, up until 2014, the ratio generally ranged from about 1:1 to 5:1. In other words, when bullish assets hit 5 times the level of bearish assets, it could reasonably be considered an extreme. Near the market top in 2015, the ratio rose to a then record (for the period shown, at least) 13.6:1. In the ensuing correction, the ratio dropped back under 2:1 briefly near the market lows in February 2016. Since then, the ratio has steadily climbed back up, reaching close to those 2015 highs on several occasions last year. So, one could certainly have argued that sentiment was back to bullish extremes on those occasions.
However, readings in recent days should leave no doubt that short-term sentiment has gotten a bit frothy. That’s because the ratio has jumped to previously uncharted levels near 20:1.
Here is the ratio versus the S&P 500.

So what does this mean? Is the stock rally doomed? Is the market in imminent danger of a serious correction?
First off, the concern here, in our view, is in the short-term. This data point suggests things have become just a bit too frothy in the near-term. Thus, the market may be at risk of a short-term, or temporary, consolidation or retrenchment in order to alleviate some of this extreme bullishness. That said, it does not meant that the market cannot continue to rally in the immediate-term. However, given the level of the ratio, whatever further near-term gains accrue, they are probably likely to be given back before another sustainable leg higher commences.
In general, however, this market is still hitting on most cylinders, from a breadth standpoint as well as the solid price structure across most equity segments. Thus, whatever the near-term risk that has arisen in recent days, it is likely not enough to derail the overall rally, and it certainly is not enough to alter our continuing intermediate-term bullish view.
Wondering how to navigate this heightened potential short-term risk within the longer-term uptrend? With our “all-access” service, The Lyons Share, you can follow our investment process and posture every day — including insights into what we’re looking to buy and sell and when. Thanks for reading!
_____________
Disclaimer: JLFMI’s actual investment decisions are based on our proprietary models. The conclusions based on the study in this letter may or may not be consistent with JLFMI’s actual investment posture at any given time. Additionally, the commentary provided here is for informational purposes only and should not be taken as a recommendation to invest in any specific securities or according to any specific methodologies. Proper due diligence should be performed before investing in any investment vehicle. There is a risk of loss involved in all investments.


4 Comments