
Stock Allocations Approaching Dotcom Levels
AAII’s allocation survey shows stock investment at the highest level since 2000.
Yesterday, we highlighted a measure of money flow that suggested short-term bullish sentiment may be getting a tad bit extreme. Today, we look at another series currently indicating a potential elevated extreme in stock investment — only from a longer-term perspective.
Each month, the American Association of Individual Investors (AAII) surveys its member regarding their current level of stock, bond and cash allocation (this is separate from the weekly stock sentiment survey published by AAII which has become too volatile and erratic to be a consistently useful sentiment tool, in our view). The monthly allocation survey tends to move at a measured pace, dictated by the movement in asset prices. Thus, we have found it to be a fairly useful barometer of longer-term investor sentiment.
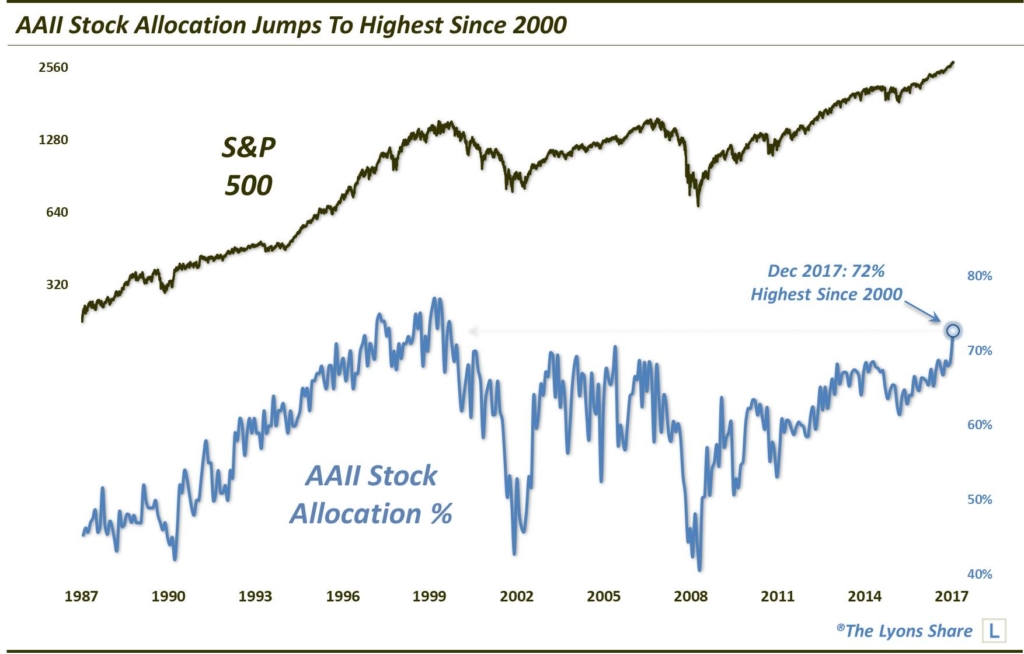
Investor stock allocation in the survey, which began just after the crash in 1987, has ranged from a low of 41% at the depth of the financial crisis in early 2009 to a high of 77%, hit at the peak of the dotcom bubble in early 2000. Interestingly, despite the post-2009 bull market’s relentless ascent by stock prices — particularly in recent years — AAII stock allocation has remained relatively subdued. It’s high during the past 9 years was “just” 69%, registered in late 2014 and early 2015 as well as a few times last year. We say “just” because, while there have certainly been elevated readings on a historical basis, we would not characterize any of them as “frothy” by any means. Until, perhaps, now.
The December reading of the AAII stock allocation jumped from 69% up to 72%. That marks the highest level of stock allocation since the heady days of the 2000 dotcom bubble. Furthermore, the 3% jump in allocation was the largest monthly increase in 4 years. Thus, you have an elevated and accelerating degree of bullishness — a possible indication of the froth that has remained largely elusive despite the recent record-breaking rally.
So does this mean that the stock market is a bubble on the verge of implosion? Of course not. In the near-term, the stock market will do whatever it wants. That includes the possibility of rallying for several more years, despite the present elevated reading. Stocks did precisely that in the lead up to the 2000 bubble burst, first registering a reading of 72% in late 1997. Do we believe this bull market has several more years left in it? No, but the point is that it is difficult to derive any precise timing from this indicator.
We will simply say that this reading implies a significant level of potential longer-term risk in the market. It is not going to be a catalyst in causing a market reversal and subsequent correction. However, if the market does start to head meaningfully lower, this condition could exacerbate the decline given the amount of capital with the potential to exit the market. In such an event, the substantial potential risk could, thus, become manifested risk.
When will this potential risk become manifested risk? We don’t know. But we do know what models and metrics to monitor that have helped us manage investment risk for several decades. With our “all-access” service, The Lyons Share, you can follow our investment process and posture every day — including insights into what we’re looking to buy and sell and when. Thanks for reading!
_____________
Disclaimer: JLFMI’s actual investment decisions are based on our proprietary models. The conclusions based on the study in this letter may or may not be consistent with JLFMI’s actual investment posture at any given time. Additionally, the commentary provided here is for informational purposes only and should not be taken as a recommendation to invest in any specific securities or according to any specific methodologies. Proper due diligence should be performed before investing in any investment vehicle. There is a risk of loss involved in all investments.


1 Comment