
Correction Road Map – Ver 2.21 (PREMIUM-UNLOCKED)
The following post was originally issued to TLS members on February 22, 2018.
Stock averages are running into the most likely cluster of resistance in their post-correction bounce.
Hopefully you have been following along with our “correction road map” on our Daily Strategy Sessions and Weekly Macro Market Reports (we are working to get email notifications of those posts sent out as others are — we’re not sure what the hangup is, but for now, check the site by ~7:15 AM CST and they should be up). To reiterate, corrections such as the most recent episode typically follow a similar template, or road map. The map we have laid out, and continue to update every AM, has been followed by prices to a tee. This post is just a reminder of what may be to come down the “road”.
Presently, most major averages are running into the best cluster of resistance on their respective charts, at least within the confines of the recent correction range — as demonstrated by our favorite broad market index, the Value Line Geometric Composite (VLG).
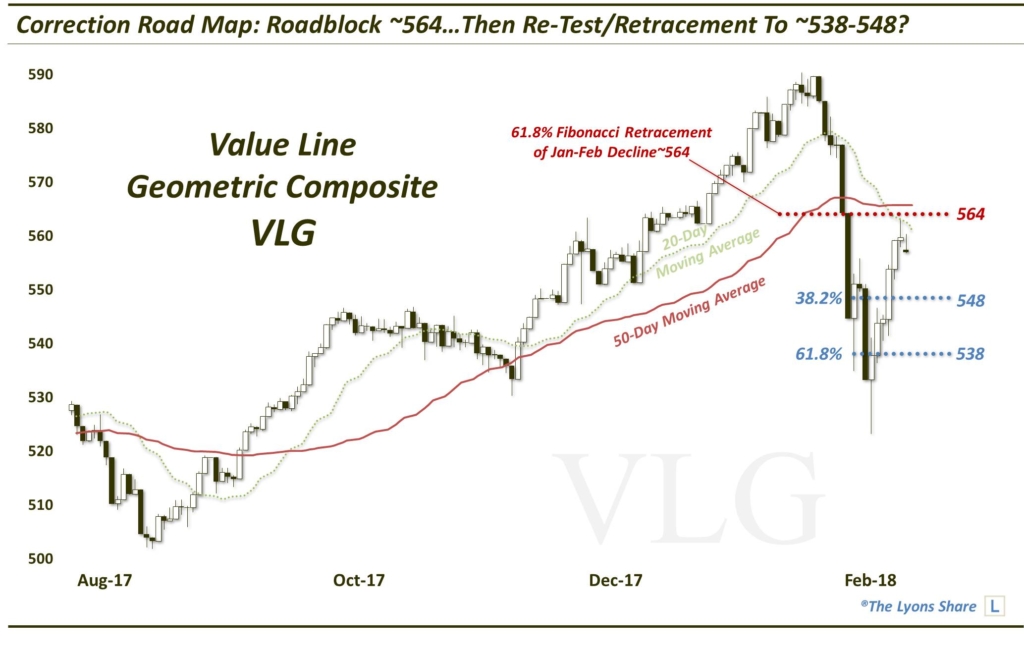
Potential lines of resistance near this level (~564) include:
- 61.8% Fibonacci Retracement of the late-January to February correction
- 50-Day Simple Moving Average
- 20-Day Simple Moving Average
A pause at these levels, or a pullback would be unsurprising. In fact, prices have been repelled by that precise area the past 3 days.
Subsequently, a retracement or full-on re-test of the initial correction lows would be the road map norm. 2 levels to watch, in our view, for a potential re-test destination on the VLG are ~548 and ~538, the 38.2% and 61.8% Fibonacci Retracements, respectively, of the current bounce. Those levels could contain a re-test and lead to the next phase of the road map — a new up-leg.
First things first, however. Look for prices to struggle at current resistance levels. Then, look for a re-test or retracement to levels mentioned. For support/resistance levels on other indices (most are in the same boat), tune into our Daily Strategy Session Charts Videos, as well as the Weekly Macro Market Report.
_____________
Disclaimer: JLFMI’s actual investment decisions are based on our proprietary models. The conclusions based on the study in this letter may or may not be consistent with JLFMI’s actual investment posture at any given time. Additionally, the commentary provided here is for informational purposes only and should not be taken as a recommendation to invest in any specific securities or according to any specific methodologies. Proper due diligence should be performed before investing in any investment vehicle. There is a risk of loss involved in all investments.


1 Comment