
Is Explosive Stock Rally The Start Of Something Bigger?
Extremely sharp bounces like we’ve seen in the stock market over the past few weeks have often served as a jump start to a much bigger, longer-lasting rally.
The swiftness and severity of the recent correction in U.S. stocks dropped a lot of jaws on Wall Street. However, almost as equally as stunning has been the recovery off of the initial correction low. For example, the S&P 500 managed to climb nearly 10% (9.75%) off of its February 9th intraday low in a mere 10 days. Such a short, sharp spike is rare, though, not unprecedented. And the few precedents that exist may hold some more good news for stock bulls.
If we include the caveat that it is coming off of at least a recent 3-month low, looking back to the inception of the S&P 500 in 1950, we find now 23 unique occurrences when the index gained this close to 10% in just 10 days. Here they are in chart form.
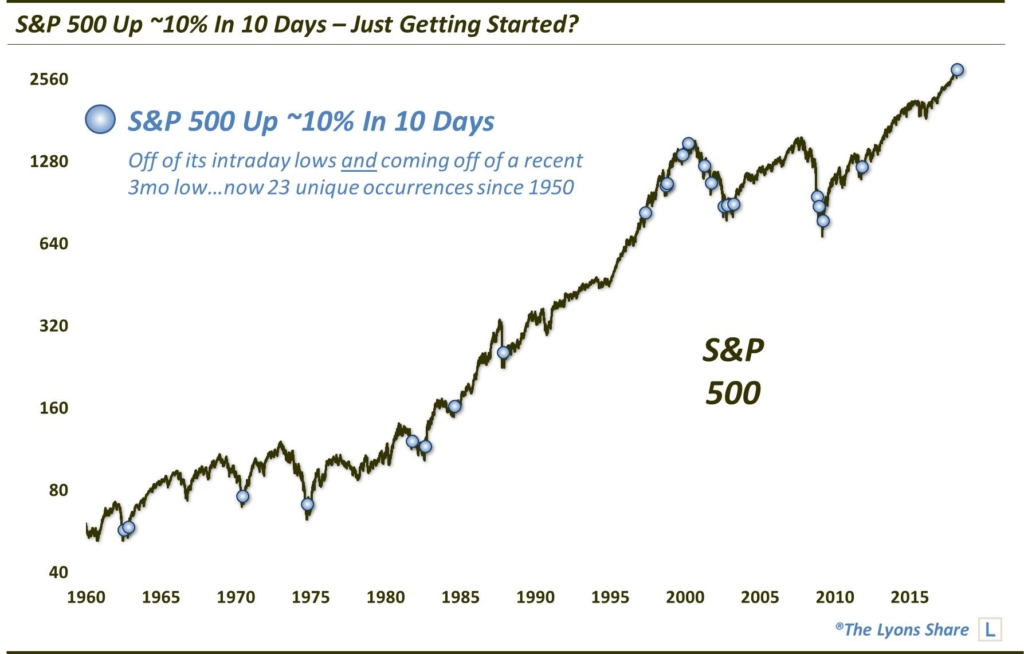
As you can see, not an insignificant number of the prior instances took place near major cyclical or intermediate-term lows — with several of them essentially putting an end to the cycle decline. Thus, in those instances, the 10% bounces were only the beginning of a larger, longer rally. For instance, of the prior 22 occurrences, the S&P 500 was higher by double digits 6 months later 12 times. By one year later, 18 of them were essentially higher by double digits.
Here are the dates of all such unique events and the S&P’s performance going forward.
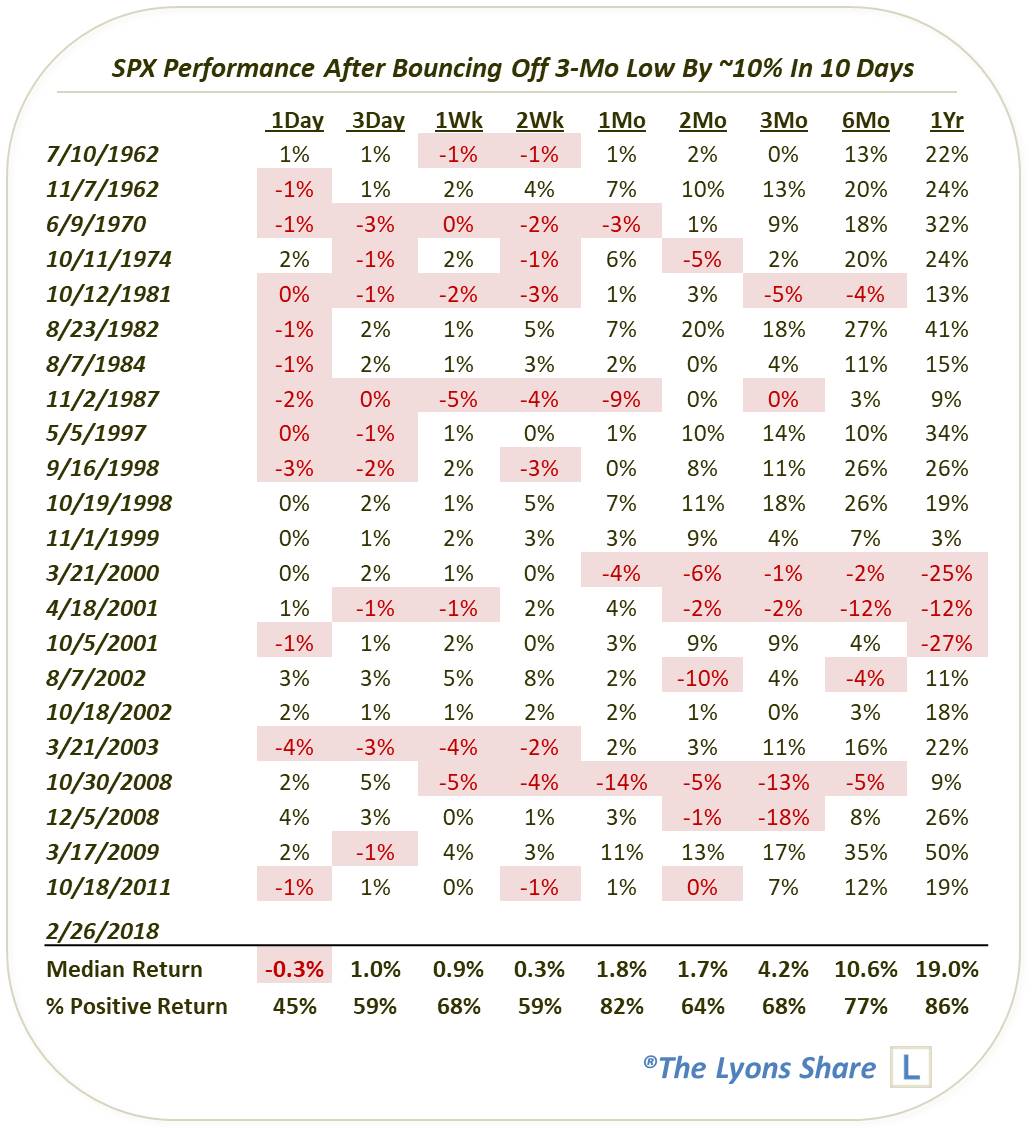
As you can see, short-term returns were a bit choppy. However, the longer intermediate-term returns were pretty good, and pretty consistently good. This study certainly isn’t the most overwhelmingly positive one we’ve looked at recently. However, much of the leakage can be attributed to the instances during the 2000-2002 and 2007-2009 bear markets. That said, it would be a stretch to compare our current market environment to that of 2001 or certainly late 2008.
One red flag that does stand out, however, is the March 2000 instance. Obviously, that took place right at the high at the time — and as it turned out, the high for the cyclical and secular bull markets. It is also an interesting precedent given the S&P 500’s current proximity to its high.
Most of the events listed took place after substantial corrections, leaving the index still well off of its highs even after its “10% in 10 Days” burst. At 3.25% from its 52-week high, the current burst left the S&P 500 as the 3rd closest to its 52-week high behind March 2000 and May 1997. And, along with November 1999, it is one of just 4 events ending less than 5% from a 52-week high. Obviously the 2000 event marked a top while the November 1999 occurred in the lead-up to the top. Still, the 1999 incident saw the S&P 500 go on to healthy further gains in the intermediate-term before topping out. So, even if we are approaching a top of some significance, there may be room for further gains first.
One more point that may be appropriate to mention is that, as suggested by the above paragraphs, this phenomenon has been less consistent in recent decades as a harbinger of longer-term gains than it was during the first 4 or 5 decades. Sure, the 1982-2000 bull market helped, but the instances during the 1966-1982 secular bear were just as reliable as intermediate-term buy signals. It doesn’t mean that the current instance will fail — its success just may not be as high-confidence a prospect as it would have been several decades ago. And our view is that it’s always important to be conscious about weighing the more recent period a bit heavier than the distant past.
What is the takeaway? The recent near-10% bounce off of the initial correction low in just 10 days certainly left the S&P 500, and market in general, a bit “overbought” or extended in the near-term. Not to mention, it brought most of the major averages right up into significant resistance, via our “correction road map“. That said, the fact that stocks rebounded so sharply from the selloff is more bullish than had they merely experienced a dead-cat bounce. And while it was perhaps more true in decades past than in recent times, such sharp bounces off of 3-month lows have often been good harbingers of even bigger gains to come in the intermediate to longer-term.
If you’re interested in the “all-access” version of our charts and research, please check out our new site, The Lyons Share. You can follow our investment process and posture every day — including insights into what we’re looking to buy and sell and when. Thanks for reading!
_____________
Disclaimer: JLFMI’s actual investment decisions are based on our proprietary models. The conclusions based on the study in this letter may or may not be consistent with JLFMI’s actual investment posture at any given time. Additionally, the commentary provided here is for informational purposes only and should not be taken as a recommendation to invest in any specific securities or according to any specific methodologies. Proper due diligence should be performed before investing in any investment vehicle. There is a risk of loss involved in all investments.


