Investors Get The Rug Pulled Again
Based on one survey, consumers’ expectations for stock market gains were never higher, or more assured, than they were in January — just prior to the stock market plunge.
“Don’t get your hopes up”, the saying goes. Of course, it is a warning in the event that the “hopes” don’t come true. While the adage does not always follow perfectly or immediately, one arena with a fair amount of historical evidence to support its notion is the stock market. And the last few months provide a perfect example.
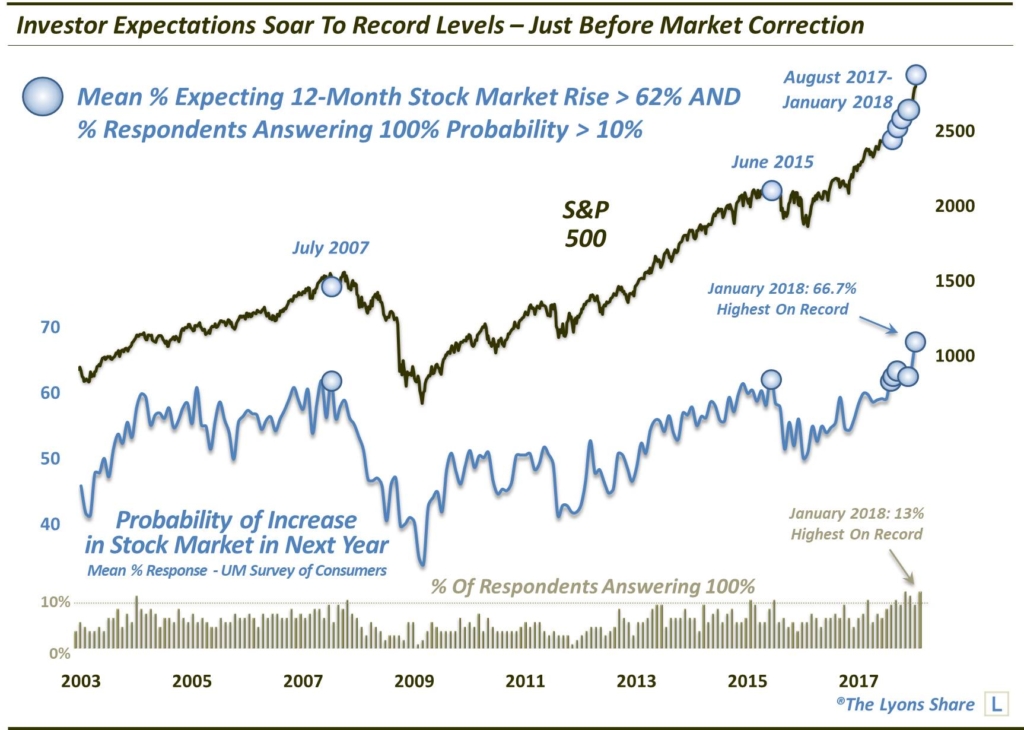
In the monthly University of Michigan Survey of Consumers, one of the questions asked of respondents is their estimation of the “probability of an increase in the stock market in the next year”. Among the various ways that the UM breaks down the data is by taking the mean response to that question. Due to the persistent stock rally, that mean response has quite elevated for the past several months. However, the January reading took things to another level as the reading soared by more than 4 percentage points to 66.7%. That is easily the highest reading in the survey’s 16-year history.
Of course, that was right before the recent correction.

Also preceding the market’s “rug pull” was another data point from the survey which provides the level of “extreme” responses in addition to the mean. When tallying the survey numbers, the UM breaks the responses down by quartiles (i.e., the % of respondents expressing a probability of a stock market increase between 1%-24%, 25%-49%, etc.). They also provide the percentage of respondents who say there is a 0% chance of a stock market rally over the following year as well as the percentage of respondents saying there is a 100% chance.
As the bottom pane in the chart reveals, in January, the percentage of respondents stating there was a 100% chance the stock market would be higher in 12 months came in at 13%. Along with this past October, that was also the highest reading on record. So, it appears as though, along with the aggregate respondent group becoming too bullish collectively, perhaps too many individuals had adopted unequivocal expectations of a market rally.
Putting the 2 series together, readings for both the mean and the percentage in the “100% camp” were unprecedented in January. If we loosen the parameters a bit, though, we can look for others junctures that saw extremes in both figures. For example, if we search for all months with mean readings above 62% and “100%” readings above 10%, we come up with the following 3 periods, as shown on the chart:
- July 2007
- June 2015
- August 2017 – January 2018
Obviously, the first 2 incidents occurred right near a cyclical top (2007) and a serious intermediate-term top (2015). So beyond the recent relatively brief, though sharp, correction, longer-term implications of unreasonably high expectations certainly remain a concern.
Lastly, the fact that we saw such a large jump (4.3%) in the survey’s mean response while the series was already elevated was a cause for concern, and may still be. Consider that the only other months that saw more than a 4% jump to at least 60% were the following:
- February 2005
- July 2007
- June 2015
We already know about the latter 2 periods. The 2005 event wasn’t such a hot time to invest either, however. While the market did avoid suffering too serious of a drawdown, the S&P 500 was unable to make any upside progress for about 9 months.
While some might dismiss these developments as coincidence, we don’t buy it. Extremes in market sentiment, and plenty of other walks of life, have a consistent tendency to experience sharp mean reversion, which serves to restore balance to the forces in question. Has the past month’s correction re-set market sentiment enough to put bulls’ minds at ease? That remains to be seen. However, the UM Survey data does potentially present a warning on a longer time frame.
If you’re interested in the “all-access” version of our charts and research, please check out our new site, The Lyons Share. You can follow our investment process and posture every day — including insights into what we’re looking to buy and sell and when. Thanks for reading!
_____________
Disclaimer: JLFMI’s actual investment decisions are based on our proprietary models. The conclusions based on the study in this letter may or may not be consistent with JLFMI’s actual investment posture at any given time. Additionally, the commentary provided here is for informational purposes only and should not be taken as a recommendation to invest in any specific securities or according to any specific methodologies. Proper due diligence should be performed before investing in any investment vehicle. There is a risk of loss involved in all investments.


1 Comment