Foundation Cracking In Most Shortable Sector? (UNLOCKED-PREMIUM)
The following post was initially issued to The Lyons Share members on September 27. The Housing Index (HGX) and iShares Homebuilders ETF (ITB) are each down roughly 12% in the 2 weeks since.
Housing stocks are threatening to break down below a critical support level.
While relative strength dictates most of our long positions and allocation, we are open to taking shots at oversold, mean-reversion candidates if the potential support levels are compelling enough. This summer, we identified a handful of such opportunities. Consumer staples worked like a charm while broker-dealers and housing stocks managed only moderate bounces. Regarding the latter two, we have repeatedly said that the longer they are unable to bounce a meaningful distance above the support level — or worse, continue to test the support level — the more likely the support is to give way. It has arguably happened in the broker stocks and is most assuredly happening now to housing stocks.
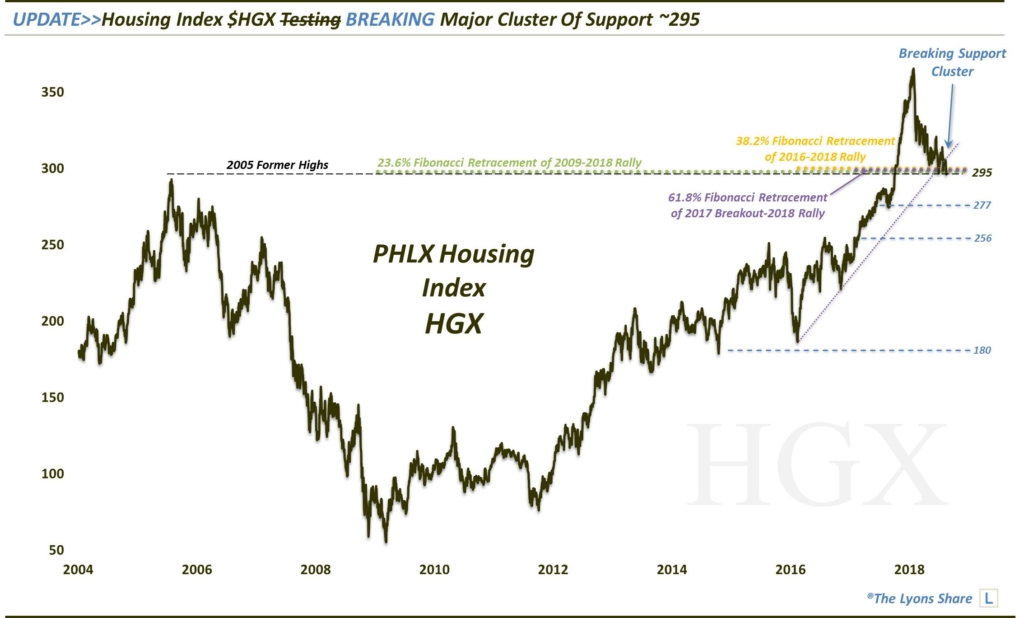
Regarding the housing breakdown, we first identified the potentially major confluence of support near the 295 level on the PHLX Housing Index (HGX) back in June. Among the considerable key support levels there included:
- The former all-time high from 2005
- The 23.6% Fibonacci Retracement of the 2009-2018 Rally
- The 38.2% Fibonacci Retracement of the 2016-2018 Rally
- The 61.8% Fibonacci Retracement of the Rally from the 2017 Breakout to-2018
- The Post-2016 Up Trendline
After bouncing a handful of times off of the 295 level, the HGX is apparently breaking down below that critical level this week.
When a market doesn’t do what it is “supposed” to do, it should send us a demonstrative message. Thus, in this case, we would not hesitate to not only ditch any long position, but also switch to a short posture — as long as the HGX remains below 295. Besides, if we are going to espouse our relative strength philosophy for buying stocks, we should do the same on the short side when it comes to relative laggards. And housing is certainly a relative laggard — and was even when attempting the mean-reversion trade at support. With that support broken, however, the relative laggard becomes an attractive short. Furthermore, with the market starting to look dicey and “toppy”, it becomes even more attractive as we start looking for short opportunities.
So what’s the best way to take advantage of this opportunity? The iShares Homebuilders ETF (ticker, ITB) has been the most reliable proxy for the HGX. And indeed, it is breaking down below the same type of support cluster as the HGX. If 295 is the magic number for HGX, the level for ITB is 37. As the chart below shows, ITB is also breaking the following support near 37:
- The 23.6% Fibonacci Retracement of the 2009-2018 Rally
- The 38.2% Fibonacci Retracement of the 2016-2018 Rally
- The 61.8% Fibonacci Retracement of the Rally from the 2017 Breakout to-2018
- The Post-2016 Up Trendline
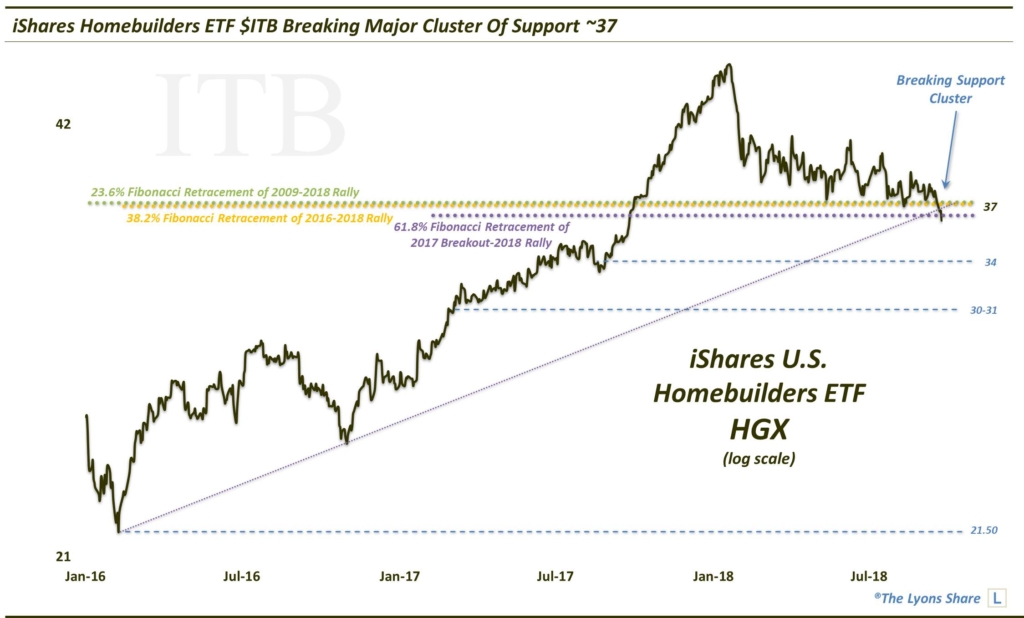
Thus, we would be willing to short the ITB as long as it remains below 37. It is certainly possible, especially if the overall market remains buoyant, that we see a false breakdown — at least temporarily. That is, we would not be surprised to see ITB test the broken 37 level (& HGX ~295) and even reclaim it temporarily. However, the chart setup does suggest that the level will eventually be broken decisively and that significant downside could very well be in the cards for the housing stocks. On the ITB, potential support/profit-taking levels below could be 34, 30-31 and 21.50 progressively.
Stay tuned to the Daily Strategy Session videos and Weekly Macro Market Reports for updates as this trade develops.
If you’re interested in the “all-access” version of our charts and research, please check out our new site, The Lyons Share. You can follow our investment process and posture every day — including insights into what we’re looking to buy and sell and when. Thanks for reading!
_____________
Disclaimer: JLFMI’s actual investment decisions are based on our proprietary models. The conclusions based on the study in this letter may or may not be consistent with JLFMI’s actual investment posture at any given time. Additionally, the commentary provided here is for informational purposes only and should not be taken as a recommendation to invest in any specific securities or according to any specific methodologies. Proper due diligence should be performed before investing in any investment vehicle. There is a risk of loss involved in all investments.