
What Does Fast Start Mean For Stocks In 2019?
Big gains to start the year have historically brought longer-term gains for stocks — with one notable exception.
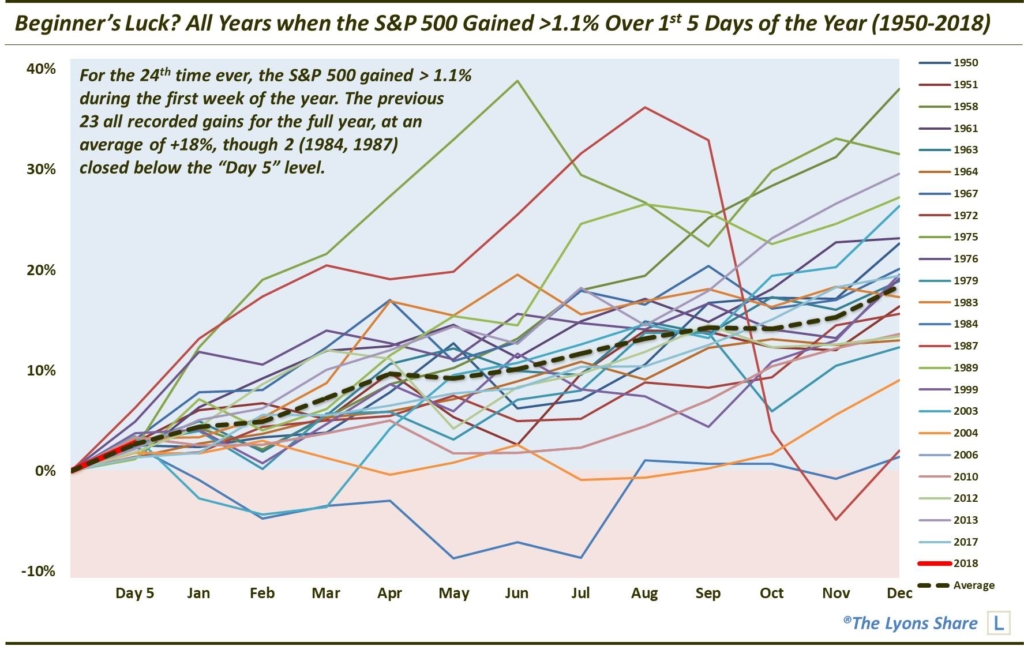
Exactly one year ago, we published a post noting the stock market’s considerable gains (+2.77%) over the first 5 trading days of 2018. While we mentioned that the seasonal data point was not necessarily something that would guide our investment decisions, we did post a chart showing how similar fast starts in the S&P 500 had, without exception, historically led to positive longer-term gains. Specifically, “looking back to the index’s start in 1950, there have been 23 years prior to 2018 that saw the SPX (gain at least 1.1% the first 5 day of the year). As it turns out, all 23 finished the full year in positive territory, with an average gain of +18%.”
Here is the chart from that post:
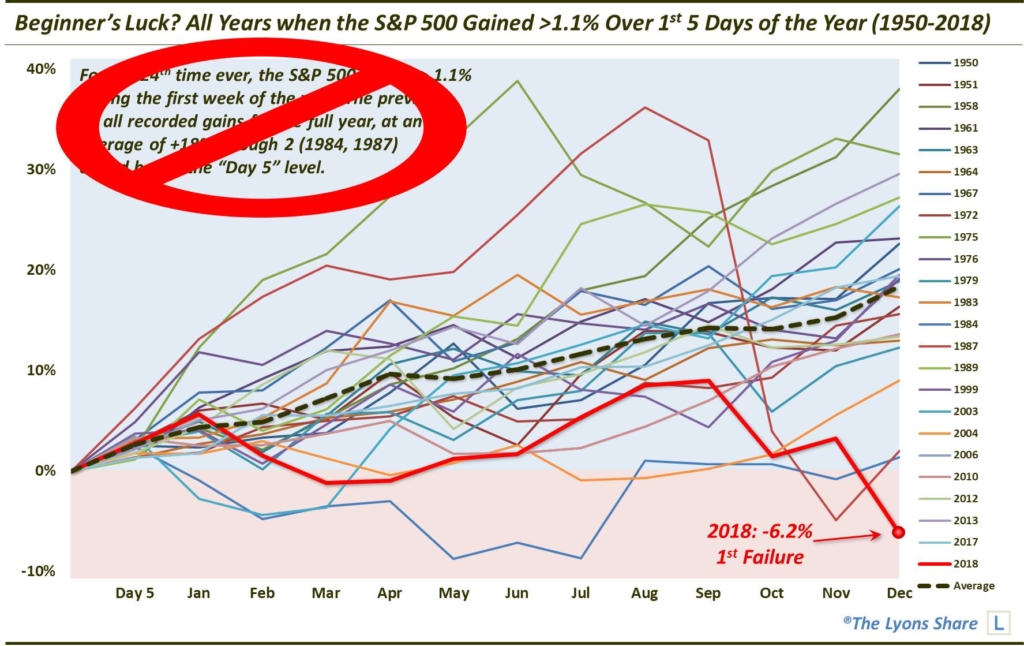
Well, unless you live under a rock, you know how this one turned out. Like many trends in the stock market and elsewhere, once they are discovered or popularized, they tend to fail. To the extent that this study did indeed exhibit a trend, and to the extent that its discovery was a widespread relevant event, this data point fell into the “failure” bucket last year as the S&P 500 ended up losing some 6% for the year.
Does last year’s failure mean that we should dismiss any longer-term implications of the S&P 500’s similar ~2.7% gain during the first week of 2019? Not necessarily. We should probably dismiss them because there is no real good rationale for paying attention to them — at least as it pertains to guiding one’s investment decisions.
Yes, 23 out of 23 is quite a track record. But there is no compelling reason to us for making a 12-month allocation based on a 5-day stretch in the market, no matter when it occurs. Every period has its own set of unique circumstances that dictates one take these seasonal studies with a grain of salt. This period is no different. In fact, given the recent action in the stock market, investors are probably best served taking this data point with a brick of salt.
For us, it means we will do what we have always done — focus on the quantitative models and strategies that have guided our investment decisions for the past many decades. FYI, with our “all-access” service, The Lyons Share, you can follow our investment process and posture every day — including insights into what we’re looking to buy and sell and when. Thanks for reading!
_____________
Disclaimer: JLFMI’s actual investment decisions are based on our proprietary models. The conclusions based on the study in this letter may or may not be consistent with JLFMI’s actual investment posture at any given time. Additionally, the commentary provided here is for informational purposes only and should not be taken as a recommendation to invest in any specific securities or according to any specific methodologies. Proper due diligence should be performed before investing in any investment vehicle. There is a risk of loss involved in all investments.


