
Options Traders Showing No Fear
A historically high percentage of stock option trades are betting on higher prices.
Whatever “wall of worry” that has served as a tailwind for stock prices of late has been completely demolished. At least, according to data from the options market. And unlike the UM survey that we highlighted last week wherein consumers were merely their voicing their optimism, this data shows that traders are actually putting money where their bullish mouths are.
To refresh, options traders use calls to bet on market gains and use puts as protection against declines. When a disproportionate amount of volume is going into calls relative to puts, it generally means traders are very bullish — and potentially too complacent about risk. We are seeing indications of that from multiple exchanges, e.g., the ISE and the CBOE.
The 2 exchanges publish ratios of volume going into calls versus volume going towards puts. In the case of the ISE, they use a call/put ratio (ISEE) on their equity options data so that a higher number indicates more bullishness. Meanwhile, the CBOE publishes a put/call ratio (CPCE) such that a lower figure signifies more bullishness. Since the ISE puts call volume in the numerator and CBOE in the denominator, we can easily combine the two into a single ratio, i.e., by dividing the ISEE by the CPCE, to generate a more comprehensive indicator of option sentiment. It is now historically high.
On Monday (2/10), the ISEE came in at a reading of 1.85, indicating 1.85 times more volume in equity calls than puts. Meanwhile, the CPCE registered .46, indicating that put volume was less than half that of call volume. Dividing the ISEE by the CPCE, we get a reading of 4.02, just the 7th reading above 4 in the last 4.5 years. Yesterday (2/11), despite the late-day selloff, options traders bulled their horns even more. The ISEE came in at 2.28 while the CPCE registered .45. That equates to a combined ratio of 5.06, the highest reading in over 5 and a half years.
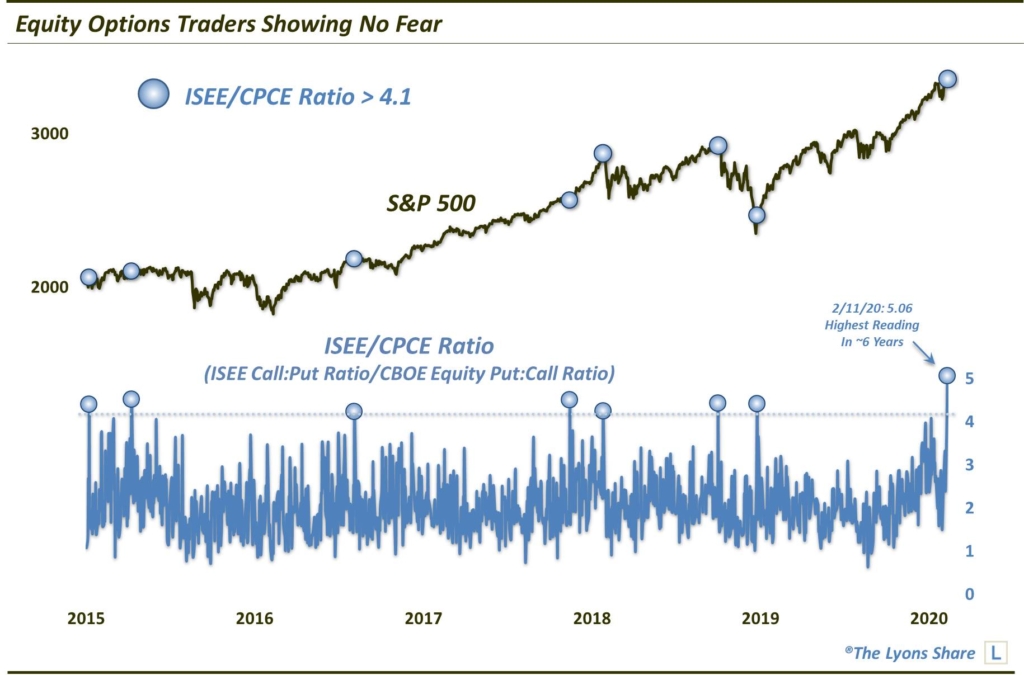
As the chart indicates, the relatively few readings over 4.1 during that period have mostly occurred at inopportune times in the market, e.g., intermediate-term tops in mid-2015, mid-2016 and January and October 2018. No, the indicator is not foolproof as the “false” readings in November 2017 and December 2018 will attest. However, given the lion’s share (pun intended) of recent readings, this apparent indicator of extreme complacency — or lack of fear — does give us some pause when considering the further near-term potential of the stock rally.
How much “stock” are we putting into this data point? Does it have us bailing out of stocks — or even going short? If you’re interested in an “all-access” pass to all of our charts, research — and investment moves — please check out our site, The Lyons Share. You can follow our investment process and posture every day — including insights into what we’re looking to buy and sell and when. Thanks for reading!
_____________
Disclaimer: JLFMI’s actual investment decisions are based on our proprietary models. The conclusions based on the study in this letter may or may not be consistent with JLFMI’s actual investment posture at any given time. Additionally, the commentary provided here is for informational purposes only and should not be taken as a recommendation to invest in any specific securities or according to any specific methodologies. Proper due diligence should be performed before investing in any investment vehicle. There is a risk of loss involved in all investments.


