Investors Get Another Chance To Hop On The FTSE Bus (UNLOCKED-PREMIUM)
This piece was originally posted for TLS members on April 25, 2017.
The UK’s FTSE-100 dropped to once again test the level of last year’s breakout to all-time high.
There was no shortage of breakouts among global equity markets in 2016. Perhaps the most monumental, however, was that of the UK’s FTSE-100. Following a 15-year triple top between 1999 and 2014, and a false breakout in 2015, the UK’s benchmark index finally managed a seemingly successful breakout to new all-time highs, as we noted in a post at the end of 2016. After about a 3.5% pop to start the year, the FTSE returned to test the level of its breakout, around 7100, near the end of January, as we indicated to investors at the time. Or, as we put it, the FTSE appeared to be giving investors another chance to “”board the FTSE bus” prior to an ultimate run higher. Indeed, the test proved successful and the FTSE subsequently took investors along for the ride, to the tune of 5% into mid-March.
It appeared as though the bus had left the station and those investors who had failed to jump aboard at the end of January had likely missed the bus completely. However, last week, following the snap election news out of the UK, the FTSE bus once again returned to the spot of its breakout, giving investors one more chance to hop aboard. However, they needed to hop on quickly as the FTSE has already sped out of the station as if driven by one of those belligerently impatient bus drivers. Specifically, the FTSE popped higher yesterday, gaining more than 2%.
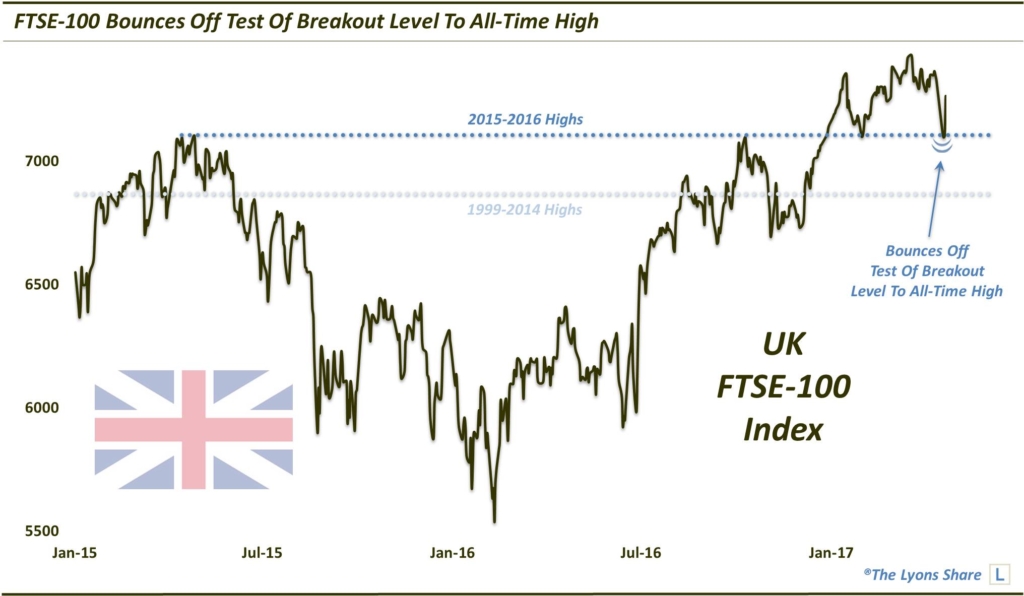
So what next? Well, if it is another successful breakout test, there should be a lot more legs to this rally, i.e., investors who failed to “board the bus” previously can still get on at the next stop without missing too much. However, it is always nice to pick one’s optimal bus stop — you just have to be ready for the bus.
How do investors take advantage of this development? The most popular ETF for British equities is the iShares UK ETF, ticker, EWU. Of course, like all international equity ETF’s, EWU is greatly impacted by the behavior of its local currency, i.e., the Pound, in this case. Because of the severe weakness in the Pound in the past few years, the EWU chart, which is priced in dollars, looks nothing like the FTSE.
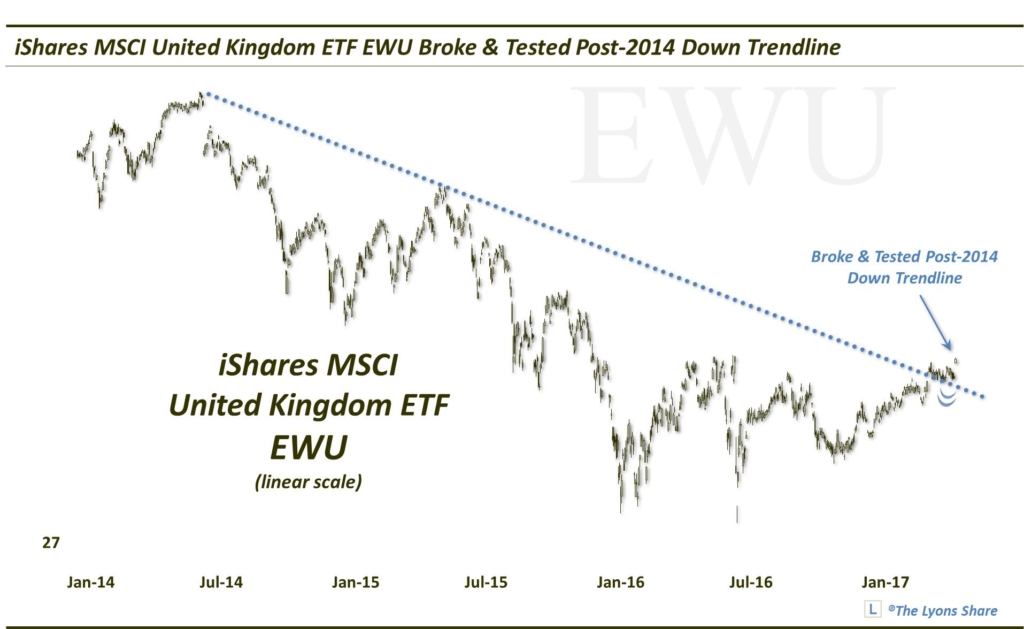
So would we recommend a currency-hedged fund instead, i.e., one that essentially shorts the Pound to flip the currency effect. We’re not so sure. For one, the chart of the EWU above shows a recent break, and subsequent test, of its 3-year Down trendline. And yesterday, the fund closed at a new 52-week high. How is that possible with the FTSE still a ways from its recent high? Again, the currency effect. The British Pound has actually shown some signs of life of late.
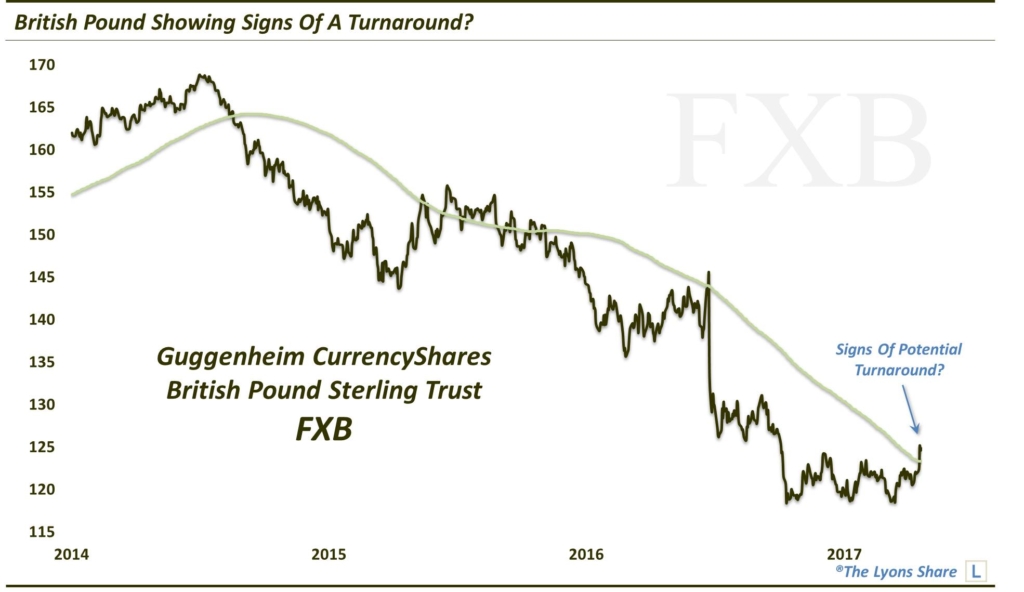
For one, it put in some combination of a triple bottom/inverse head-&-shoulders/plain old base, before breaking out above its recent range to 6-month highs, also capturing its 200-day moving average. Now, it is certainly a long ways from actually establishing a new uptrend, however, it is a start. Plus, one thing that we like when it comes to the Pound is that the “smart money” Commercial Hedgers hold a near-record net long position in Pound futures. Thus, there could be a sizable tailwind for the currency.
In summary, we would look to own UK equities with the FTSE testing or above its breakout level of 7000-7100. And we would favor non-currency hedged ETF’s at this point, like EWU, FKU or EWUS.
_____________
Disclaimer: JLFMI’s actual investment decisions are based on our proprietary models. The conclusions based on the study in this letter may or may not be consistent with JLFMI’s actual investment posture at any given time. Additionally, the commentary provided here is for informational purposes only and should not be taken as a recommendation to invest in any specific securities or according to any specific methodologies. Proper due diligence should be performed before investing in any investment vehicle. There is a risk of loss involved in all investments.

