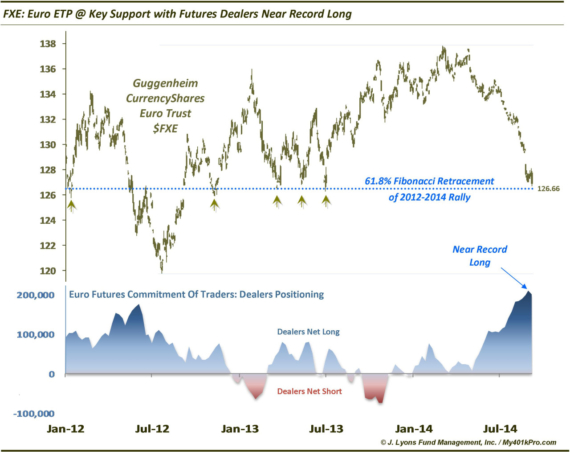
Euro at Key Support Now with Futures Dealers Near Record Long On August 12, we noted that the Euro, via the Exchange Traded Product, FXE,…
Euro at Key Support Now with Futures Dealers Near Record Long On August 12, we noted that the Euro, via the Exchange Traded Product, FXE,…
Our focus has been on Asia quite a bit in the past few months with several markets scoring big breakouts or reversals. Two markets to…
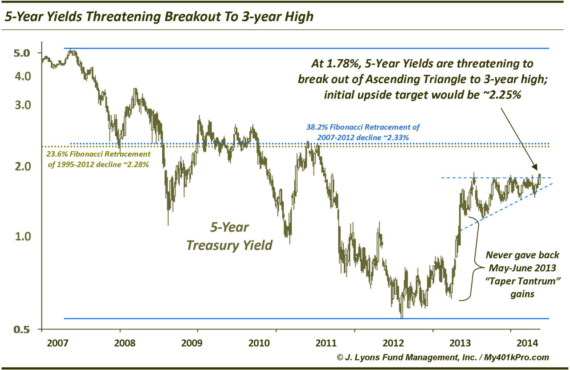
Rates ARE Rising: 5-Year Yield Highest In Over 3 Years Fellow contributor and stats guru Ryan Detrick recently reminded me of the Bloomberg survey at the…
We have posted several times regarding the risky, debt-laden European countries affectionately known as the PIIGS (Portugal, Italy, Ireland, Greece and Spain) several times in…
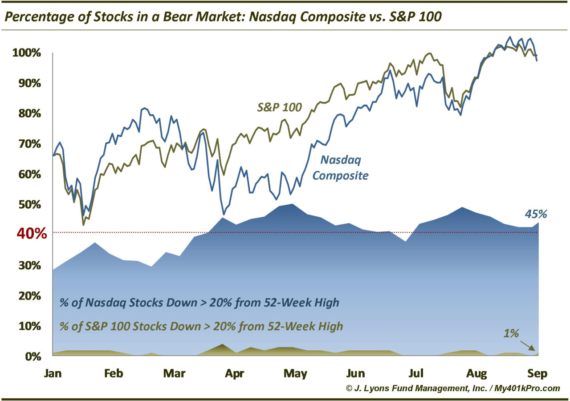
Percentage of Stocks in a Bear Market: Nasdaq vs. S&P 100 Yesterday, Bloomberg published a provocative article indicating that 47% of Nasdaq stocks were currently…
It is forming a potential short-term head-and-shoulders pattern with a neckline at $73. It once set 2 major long-term highs at $73. It sits on…
Perhaps no market in recent memory has been so characterized by the theme of “rotational leadership” as the post-2013 rally. Countless sectors and industries have…
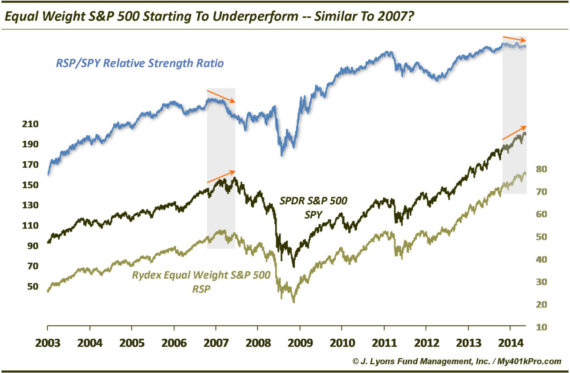
Equal Weight S&P 500 Starting To Lag – Shades of 2007? Another divergence post? Yes, sorry, we know it is getting mundane. However, we post…
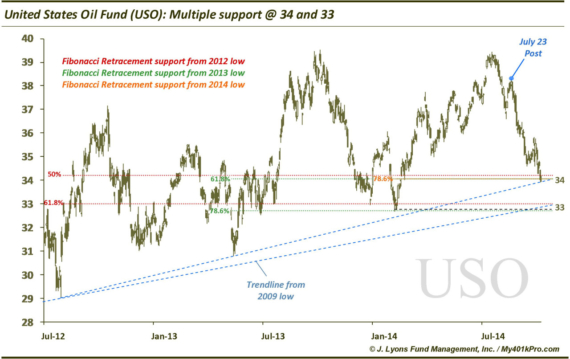
Commodity Spotlight: Oil Ready To Stop Getting Drilled? On July 23, we pointed out several layers of resistance faced by the United States Oil Fund,…
Quick, name the country whose stock market hit a 6-year high yesterday. OK, besides India…and Argentina. Believe it or not, it is Japan, at least…