2018 Chart Of The Y(B)ear
Stock bulls started out of the gates quickly in 2018 — but it’s the bears in position now to win in the long run.
12 months ago, stocks entered 2018 firing on all cylinders as much as any point in the past several years. The market was setting records in terms of both the strength of its uptrend as well as its lack of volatility. Practically all stock segments were hitting new highs and it seemed that 2018 might bring more of the same for a bull market nearing a full decade in age. However, it’s not how you start, they say, but how you finish that’s most important. For stock investors in 2018, that may be bad news.
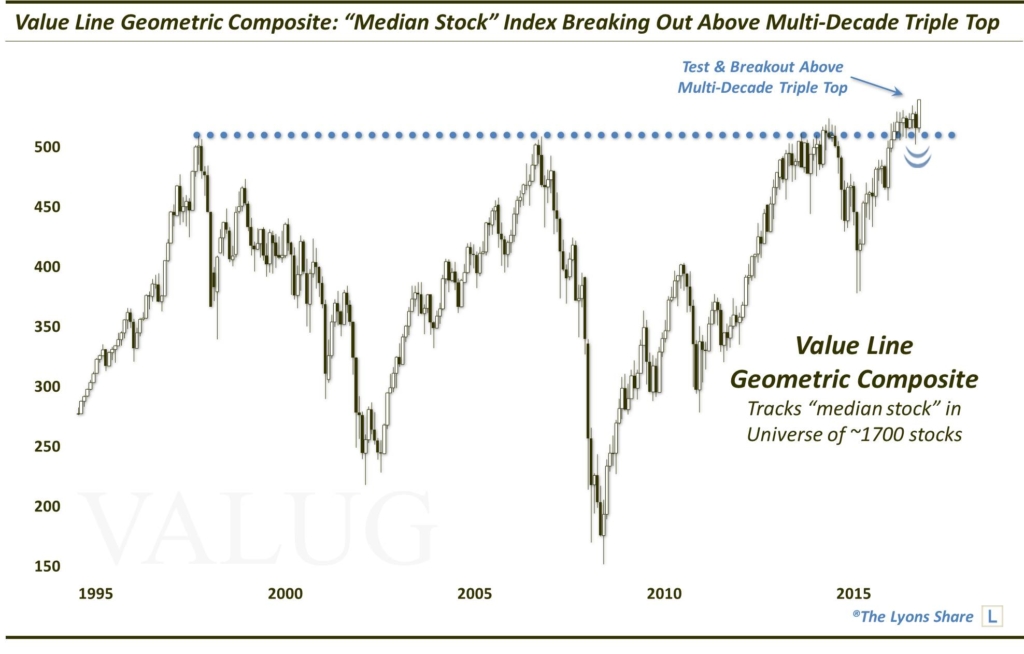
Included among those indices hitting new highs at the beginning of 2018 was our favorite stock average, the Value Line Geometric Composite (VALUG). Once again, the VALUG tracks the performance of the median stock within a universe of approximately 1700 stocks. Its status as an extensive measure of the broad equity market is the reason it is our favorite barometer of the health of the overall U.S. market. And following a breakout above a multi-decade triple top in September 2017, the VALUG was indicating an extremely healthy broad stock market as 2018 began.
From September 2017:
By late January, we began to get indications that perhaps the broader stock market was not as calm as the superficial indices would suggest. It appeared as though the market was just getting a little ahead of itself and, indeed, stocks would suffer a swift selloff into February. Given the strong foundation overall leading into the selloff, however, the market would weather the storm quite well and, by late summer, several of the popular averages would be back at new highs. This new high, however, was much different than what we saw early in the year.
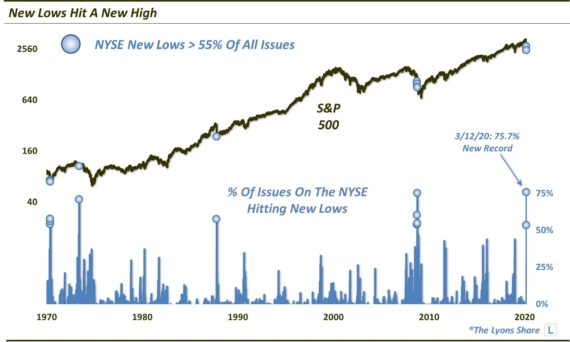
Unlike the record calm we saw to begin the year, the volatility market was not confirming the late summer new high in stocks. Furthermore, far from the pristine internals seen at the early-2018 highs, new highs in September-October occurred amidst an alarming number of individual new lows. Those conditions foretold a calamitous 4th quarter for stocks. Plus, if the action in the Value Line Geometric Composite is any guide, this might just be the beginning of something much more ominous to come.
We say that because of the VALUG’s failure to hold the level of its former multi-decade triple top breakout that we highlighted the year prior. The index did attempt to bounce off of that level, which we termed “the mother of all support levels” in late October. However, after 6 weeks of trying to hold on, the level gave way. Now, instead of an immensely positive multi-decade triple top breakout that we witnessed just about one year ago, we have an equally immensely negative false breakout.
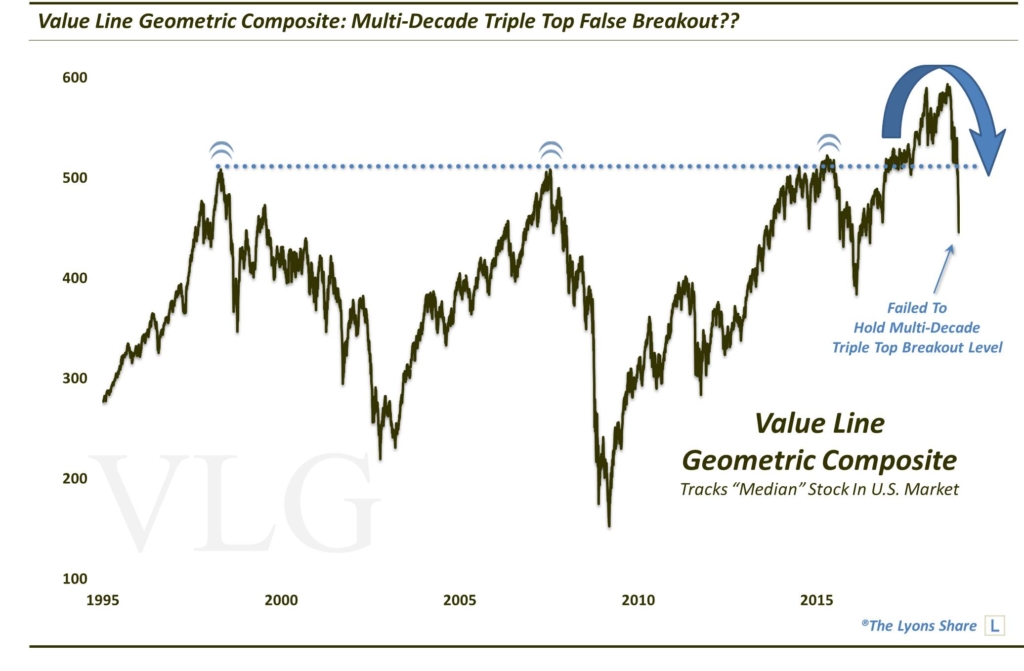
So how ominous is this “false breakout”? We don’t want to make any specific predictions or prognostications, but the implications of a multi-decade triple top false breakout can’t be overstated. And combined with the high-risk status of our longer-term “background” indicators, this 4th quarter may have only been the first lap in a long-term bear market run.
So as we wish everyone a very Happy New Year, we must do so against the backdrop of a potentially very difficult market climate. We wish we had better news, but we cannot pick and choose what type of market we have. And the reality is that 2019 may well be a very prosperous year — for the bears. For the bulls — or those passive investors just along for the ride — you might want to consider charting a different course.
If you are interested in an “all-access” pass to our research and investment moves, we invite you to further check out The Lyons Share. FYI, we are currently holding our HOLIDAY SALE, offering big savings for new members (THIS IS THE LAST DAY!!). So considering the discounted cost and the current treacherous market climate, there has never been a better time to reap the benefits of our risk-managed approach. Thanks for reading!
_____________
Disclaimer: JLFMI’s actual investment decisions are based on our proprietary models. The conclusions based on the study in this letter may or may not be consistent with JLFMI’s actual investment posture at any given time. Additionally, the commentary provided here is for informational purposes only and should not be taken as a recommendation to invest in any specific securities or according to any specific methodologies. Proper due diligence should be performed before investing in any investment vehicle. There is a risk of loss involved in all investments.