The S&P 500-VIX Standoff – Part 2
Earlier this month, we looked at the circumstances present at the time whereby the S&P 500 and the VIX (S&P 500 Volatility Index) were both…
Earlier this month, we looked at the circumstances present at the time whereby the S&P 500 and the VIX (S&P 500 Volatility Index) were both…
Given the ubiquitous media attention, the investment world appears to be fixated on the possibility (and inevitability?) of the Nasdaq’s return to its 2000 record…
Almost 1 year ago, we issued a Chart Of The Day on India’s main stock index, the S&P BSE Sensex. After topping out near the…
Over the past 2 years, there has perhaps been no trickier equity index worldwide than the London FTSE-100. After topping out at the same proximate…
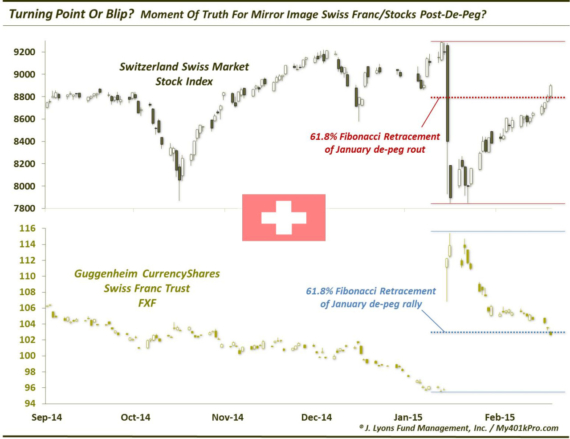
Moment Of Truth For Mirror Image Swiss Stocks, Franc Post De-Peg? The Swiss National Bank sent ripples throughout the financial world on January 15 when…
Back in July we posted a provocative chart of the Value Line Geometric Composite (VLG). The VLG is a broad index of approximately 1800 stocks…
With all eyes focused on the Nasdaq approaching its 2000 highs, one aspect of its recent ascent may be overlooked. There are fewer and fewer…
Volume has long been a topic of debate on Wall Street. Some folks argue that elevated volume is needed to “confirm” price moves. Others say…
If you’re like us, maybe you wonder why gas prices always seem to go up a lot faster than they come down. That’s our anecdotal…

LUV Southwest Airlines’ Double Since Last Valentine’s Day A year ago, our Chart Of The Day was Southwest Airlines, in honor of Valentine’s Day (you…