Oil Services Sector Reaches Resistance Magnet On March 19, as the oil complex was attempting to hammer out a low, we posted a chart on…
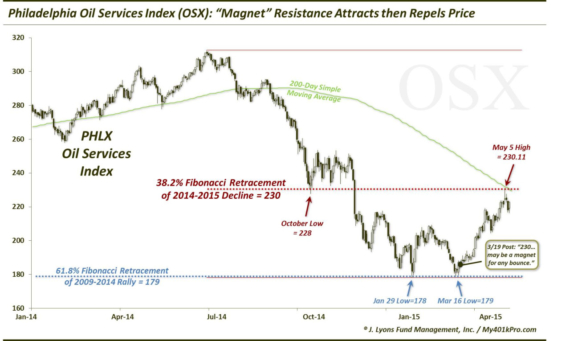
Oil Services Sector Reaches Resistance Magnet On March 19, as the oil complex was attempting to hammer out a low, we posted a chart on…
On March 13, we posted a piece on the divergence between the Euro and the Euro Volatility Index (EVZ). The EVZ (like most volatility indexes)…
We don’t often discuss individual stocks, either in our practice or in these pages. So when we dedicate our Chart Of The Day to a…
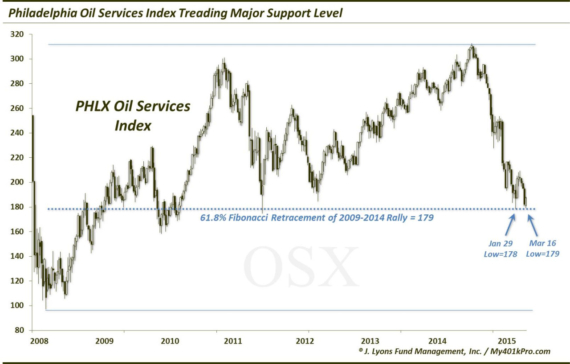
Oil Services Sector Treading Major Support Level After being bludgeoned in the back half of 2014 (to the tune of -35%) along with all oil-related…
If you’re like us, maybe you wonder why gas prices always seem to go up a lot faster than they come down. That’s our anecdotal…
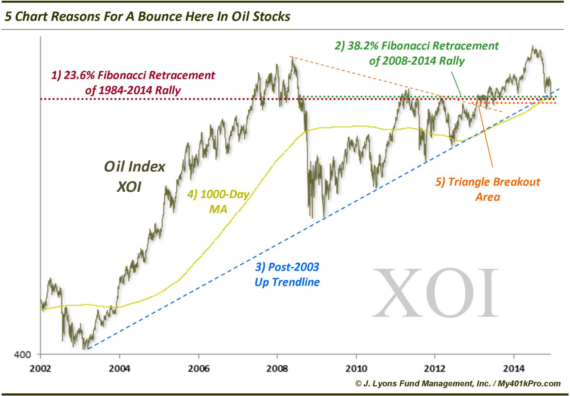
5 Chart Reasons For A Bounce In Oil Stocks Earlier today, we put up a post revealing that total assets in Rydex energy sector funds…
One of the casualties of the rout in oil prices and associated stocks, not surprisingly, has been the amount of assets invested in related energy…
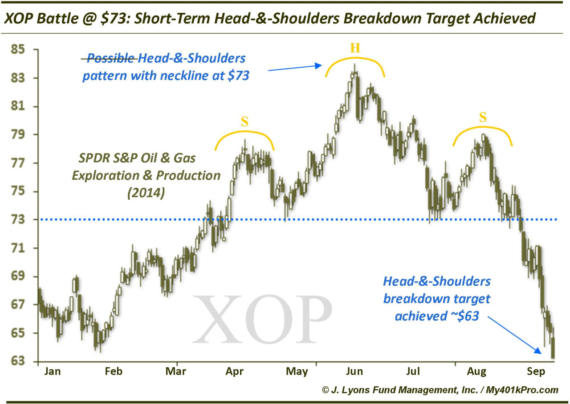
Oil $ Gas ETF Head-&-Shoulders Target Achieved In a September 15 post, we labeled the SPDR S&P Oil & Gas E&P ETF (XOP) the “most…
It is forming a potential short-term head-and-shoulders pattern with a neckline at $73. It once set 2 major long-term highs at $73. It sits on…
In our ChOTD on 4/22/14, we noted that the SPDR S&P Oil & Gas E&P ETF ($XOP) was breaking out of a long-term cup-&-handle formation.…