Record spike in Inverse ETF Volume one sign of a bottom Over the past 2 years, one of our favorite indicators of stock market sentiment…
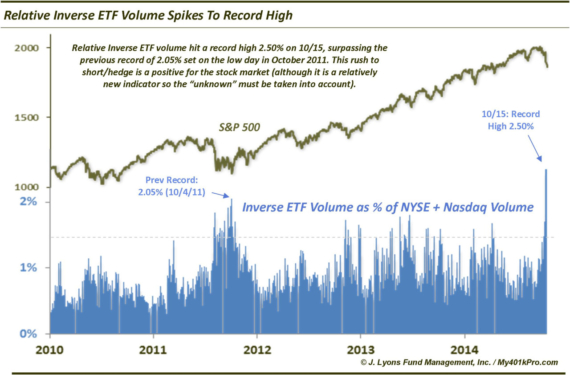

Record spike in Inverse ETF Volume one sign of a bottom Over the past 2 years, one of our favorite indicators of stock market sentiment…
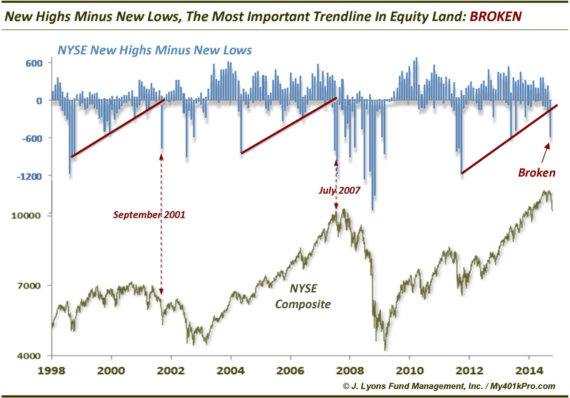
UPDATE: The Most Significant Trendline In Equity Land = BROKEN On September 25, we presented what we termed, The Most Important Trendline In Equity Land, namely…
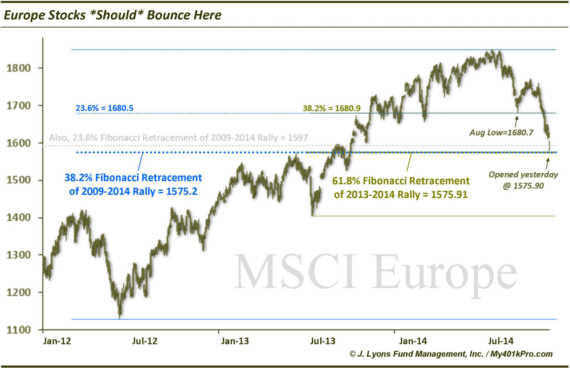
European stocks *should* bounce here On August 13, we mentioned that European stocks, as represented by the MSCI Europe Index, had bottomed a couple days…
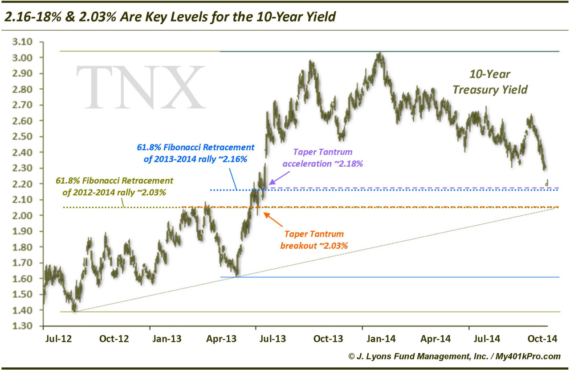
10-Year Yield Near Key Levels Now In a May 14 post, we pointed out a breakdown in the 10-Year Treasury Yields below 2.60%. Although, as…
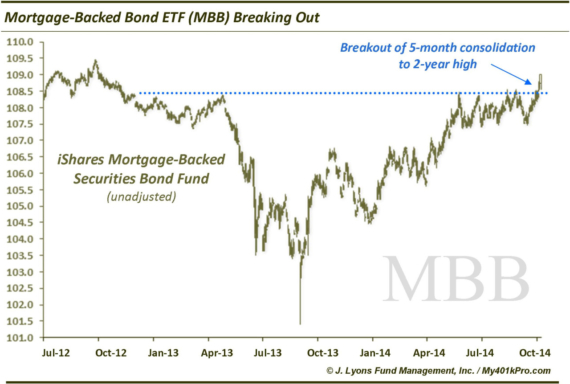
Taper This! MBS Bond ETF Breaking Out With all the fear and loathing surrounding the Fed’s tapering of its latest bond-buying QE binge, someone forgot…
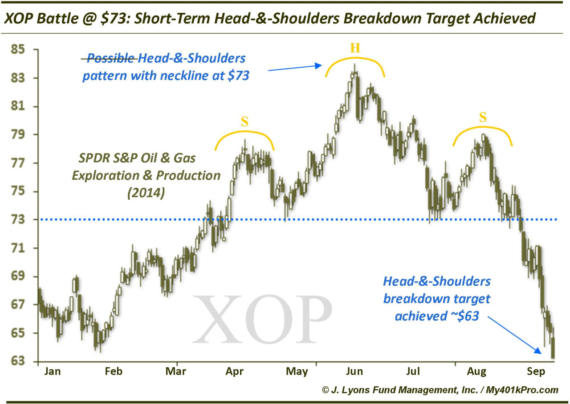
Oil $ Gas ETF Head-&-Shoulders Target Achieved In a September 15 post, we labeled the SPDR S&P Oil & Gas E&P ETF (XOP) the “most…
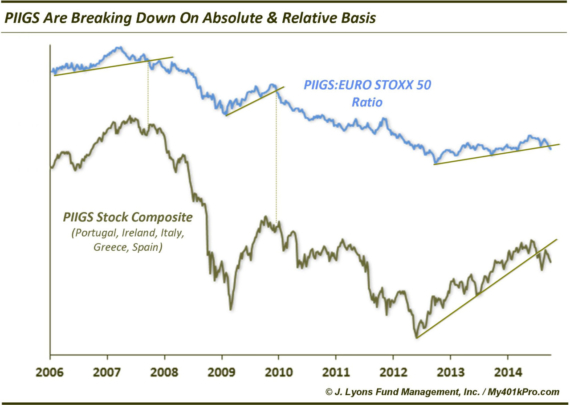
The PIIGS are Starting to Squeal Again Cue the hideous techno-80’s music and roll the credits – the European vacation is over. We warned on…
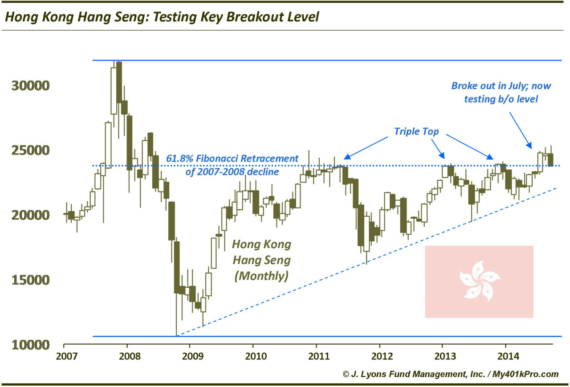
Hong Kong Hang Seng Testing Key Breakout Level On September 9, we posted a chart showing a key long-term breakout in the Hong Kong Hang…
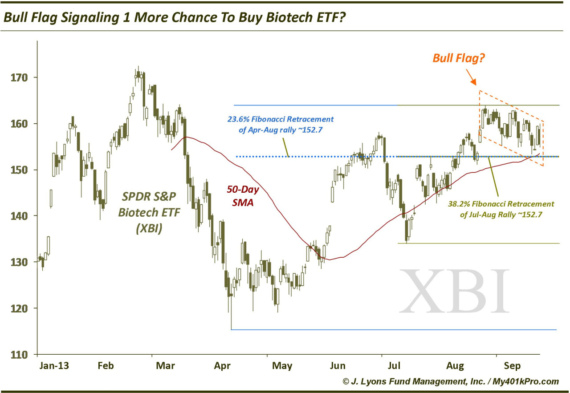
Bull Flag Signaling 1 More Chance To Buy This Biotech ETF? Biotech stocks have alternated between hero and villain in 2014 (FYI, we have been…
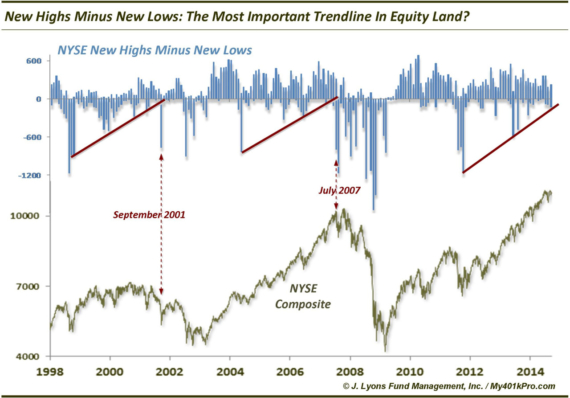
The Most Important Trendline In Equity Land: New Highs-New Lows The problem with trendlines is that they are usually subjective. Rarely are they cut-and-dry. And…