Commodity Spotlight: Besieged CRB Index At Key Level
After a strong performance in the 1st half of the year, the Reuters-Jefferies CRB Index has been under significant pressure lately. It is down 8% in…
After a strong performance in the 1st half of the year, the Reuters-Jefferies CRB Index has been under significant pressure lately. It is down 8% in…
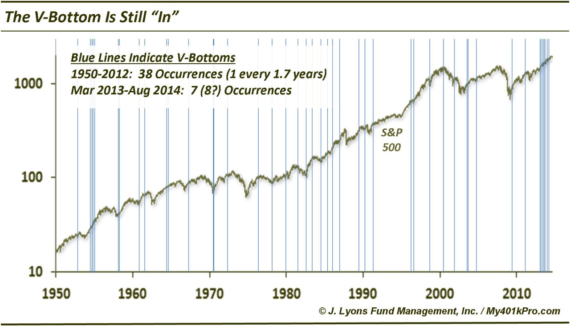
The V-Bottom Is Still In Fashion Back in February, we posted a chart on a new fad that was all the rage on Wall Street:…
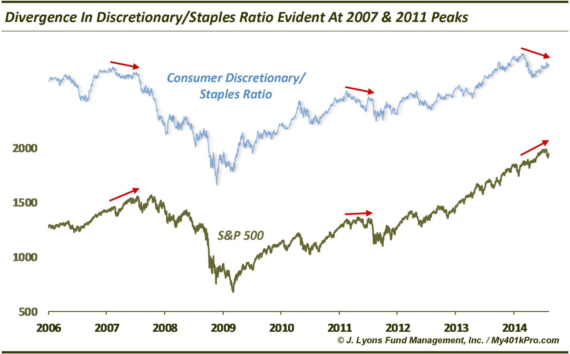
Divergence in discretionary vs. staples stocks a red flag After a brief pause on Friday for Mr. Putin’s VIX day-trade, another V-bottom continues apace in…
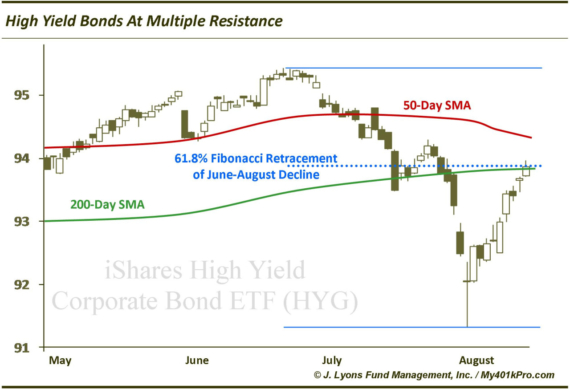
High yield bonds: the bear battle begins Perhaps no other market symbolizes this unprecedented central bank induced yield-reach era more than the high yield bond…
Sounds crazy, I know – that a stock breaking out might be sending a bearish signal for the stock market. It probably sounds particularly heretical…
On July 11, we posted a chart noting the initial stages of a potential long-term bottom in the Copper ETN JJC. The key points in…
As it pertains to the recent sell off in stocks, no region got hammered worse than Europe. The damage there was across the board as…
We take a step away from equities today to focus on the Euro currency. The Chart Of The Day that we posted earlier on Twitter…
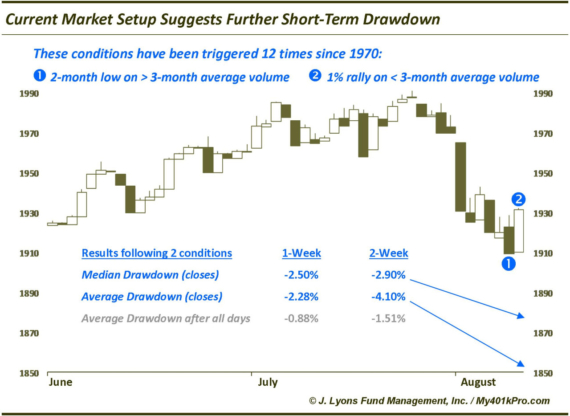
Current setup suggests further short-term stock market weakness (Edited to add last paragraph and table) With the S&P 500 futures ripping a slingshot 50-handle bounce…
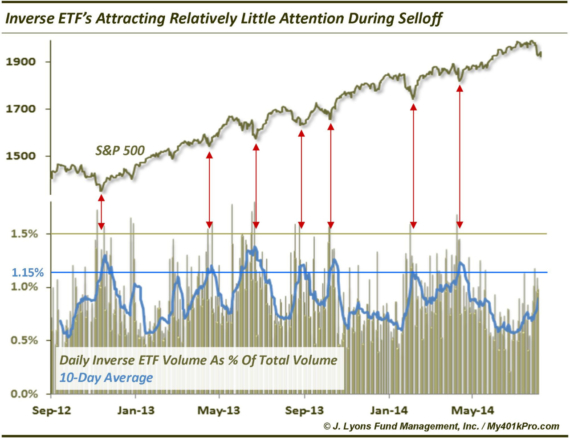
Subdued inverse ETF volume far from fear levels We’ve pointed out evidence of elevated fear (at least in the short-term) coming from the equity options…