In early December, we took a look at a variation of the notorious “Hindenburg Omen”, a supposed signal of forthcoming trouble in the market. For those…
Tagged new highs
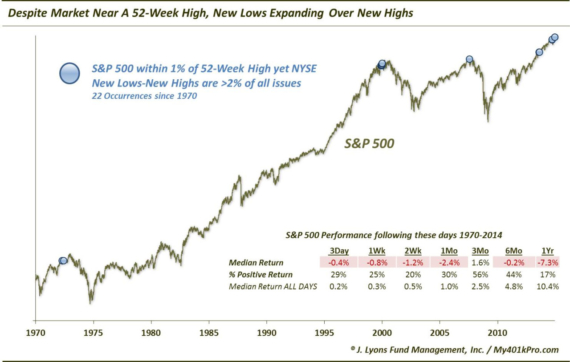
Chart: Market Near High But Substantially More New Lows Than Highs More color in our post from earlier today. ________ More from Dana Lyons, JLFMI and My401kPro.
Internal Cracks Threaten Stock Market’s Foundation
Market technicians are often accused of data manipulation when implementing historical tests. Through data-mining, curve-fitting, goal-seeking and the like, the complaint is that, intentionally or not, the…
Is The Abundance Of New Highs AND New Lows A Bad Omen For Stocks?
Maiden voyage of the USS Akron Market analysts sometimes like to attach colorful names to an indicator or set of financial conditions. This is likely in…
Freaky Friday: More Disturbing Behavior From The Stock Market
A few weeks ago, we dedicated a post to the unusual behavior in the stock market on November 13. Although the major indices closed the…
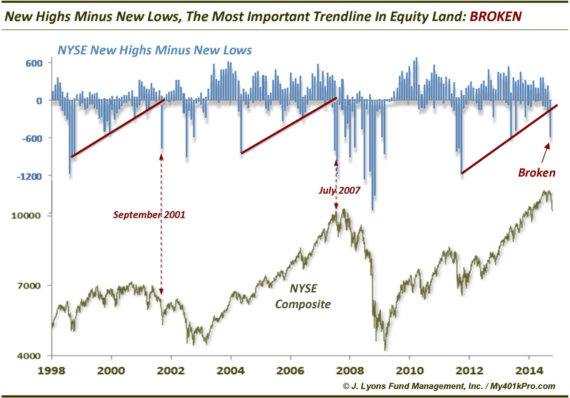
UPDATE: The Most Significant Trendline In Equity Land = BROKEN On September 25, we presented what we termed, The Most Important Trendline In Equity Land, namely…
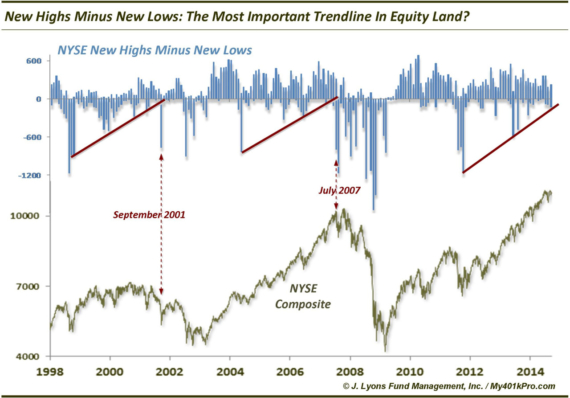
The Most Important Trendline In Equity Land: New Highs-New Lows The problem with trendlines is that they are usually subjective. Rarely are they cut-and-dry. And…
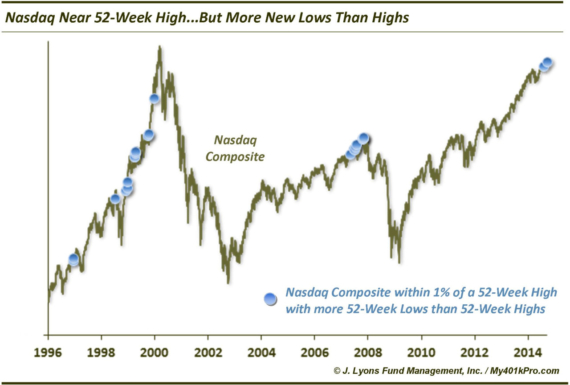
Nasdaq near 52-Week High…but more New Lows than Highs We’ve been discussing the gradual thinning of the stock market rally over the past several months.…
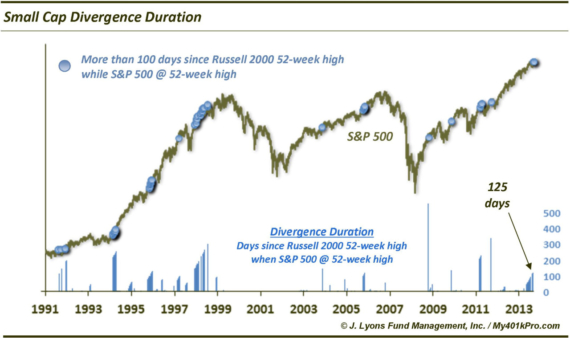
Is the duration of the small cap divergence a concern? We have commented on many occasions about the importance of broad participation of stocks and…
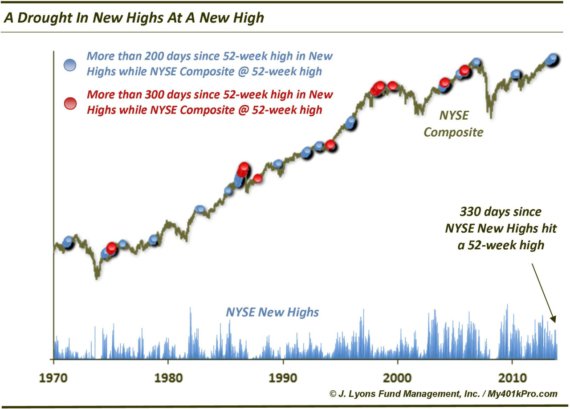
52-Week Highs Struggling To Reach 52-Week Highs The grand daddy of all breadth indicators, the NYSE advance-decline line, recently made an all-time high. This is…