The S&P 500 has now tied a record with 9 consecutive days trading within the range set 10 days ago; what are the ramifications of…
Tagged $^OEX
Slump In Smallest Stocks Vs. Biggest Stocks Is Getting Worse
Micro-cap stocks have suffered a key breakdown relative to mega-cap stocks, suggesting a “risk-off” shift on the part of investors. One of the themes in…
Smart Money Options Indicator Now ‘Off The Charts’ Bearish
We have mentioned the put/call ratio of open interest on S&P 100 (OEX) options a handful of times over the past 6 months or so.…
“Smart Money” Indicator Most Bearish In 16 Years
Most of the volume data (i.e., Put/Call ratios) that we look at from the equity options market are best utilized on a contrarian basis. That…
Smart Money Options Traders Displaying Extreme Caution
A good portion of our research deals with the behavior of select groups of investors. The majority of the time, our objective is to identify…
5 Most Viewed Charts Of 2014
As we wrap up 2014, we are looking back at the key moments, trends, stats and, of course, charts that defined the year in the…

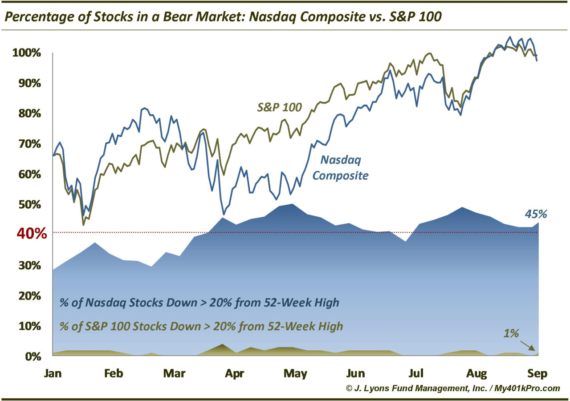
Percentage of Stocks in a Bear Market: Nasdaq vs. S&P 100 Yesterday, Bloomberg published a provocative article indicating that 47% of Nasdaq stocks were currently…
ChOTD-6/11/14 CBOE OEX:Equity Put/Call Ratio Showing Historic Caution
Today’s ChOTD shows the ratio between one supposed smart money put/call ratio (CBOE OEX P/C) to a supposed dumb money put/call ratio (CBOE Equity P/C).…
ChOTD-6/10/14 Median Distance From 52-Week Highs: S&P 100 Vs. Russell 2000
Following in line with yesterday’s chart on the # of 52-week highs, today’s ChOTD looks at the median distance from 52-week highs among S&P 100 and…
ChOTD-6/9/14 % Of Stocks @ 52-Week Highs: S&P 100 Vs. Russell 2000
Today’s ChOTD comes out of the bottomless “divergence barrel”. This one looks at the % of 52-week highs among S&P 100 constituents vs. Russell 2000…