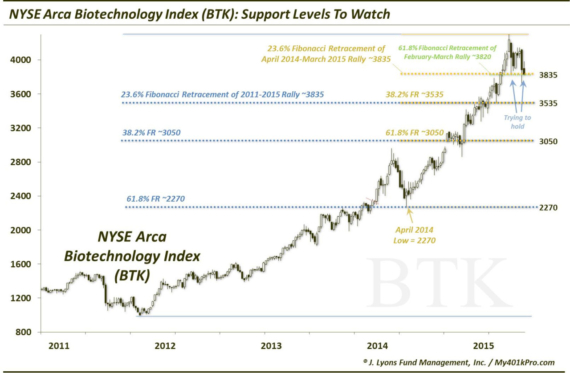
Biotech Sector: Support Levels To Watch No sector has exemplified these past few years of the cyclical bull market as much as biotechnology stocks. Likewise,…
Biotech Sector: Support Levels To Watch No sector has exemplified these past few years of the cyclical bull market as much as biotechnology stocks. Likewise,…
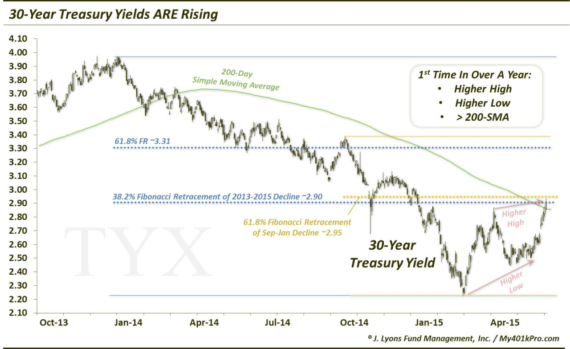
Rates ARE In Fact Rising For the better part of the last few years (decades?), if there was one thing that market strategists were sure…
** Edited to add the chart at the end. The subject of today’s Chart Of The Day seems like it may be more a matter…
For the second Friday in a row, the Nasdaq put in a rally that, under the surface, was not as impressive as its headline gain…
There is always a small but vocal contingent of market pundits calling for a stock market top. In the past few years, there has been…
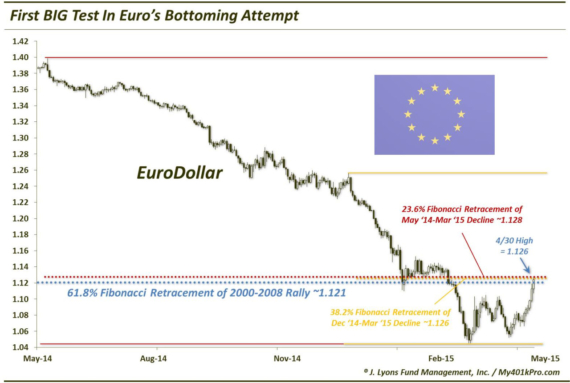
UPDATE: Euro Facing First BIG Test In Its Bottoming Attempt On March 4 we posted a piece titled “Setup In Place For Possible Euro Bottom”. In that post,…
Yesterday, we looked at the “Sell In May & Go Away” phenomenon, with a couple new twists. With many seasonality-type indicators or trends, it is common…
If you follow the stock market closely, you are no doubt aware of the “Sell in May and Go Away” adage. If not, you will…
We’ve mentioned before (alright, in nearly every post) that we have several major longer-term concerns with respect to the stock market. One such concern has…
It’s a day removed from Friday’s all-time high in the Nasdaq but we posted a couple Charts Of The Day today that had folks wondering…