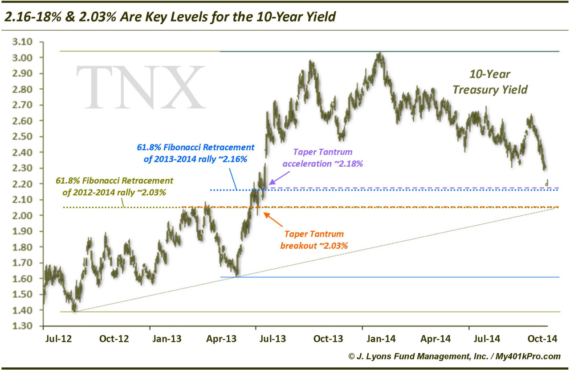
10-Year Yield Near Key Levels Now In a May 14 post, we pointed out a breakdown in the 10-Year Treasury Yields below 2.60%. Although, as…
10-Year Yield Near Key Levels Now In a May 14 post, we pointed out a breakdown in the 10-Year Treasury Yields below 2.60%. Although, as…
All good things must come to an end. That includes the S&P 500’s streak of closing above its 200-day simple moving average which ended yesterday…
Unless you have been in a bunker hiding from ebola, you’ve no doubt noticed the pick up in volatility across basically all asset classes. In…
On September 26, we wrote a post titled “90% Down Volume Days Have Been Good Buy Signals…With One Catch” looking at the phenomenon of 90%…
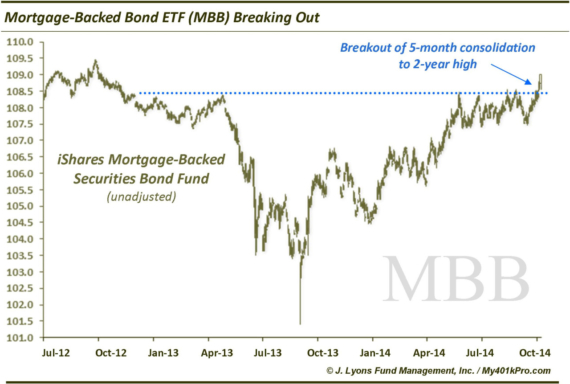
Taper This! MBS Bond ETF Breaking Out With all the fear and loathing surrounding the Fed’s tapering of its latest bond-buying QE binge, someone forgot…
In the midst of the moonshot stock rally yesterday, something unusual happened. The number of New Lows on the NYSE (and Nasdaq) expanded to a…
Yesterday, we published a post titled “The PIIGS Are Starting To Squeal Again”, noting the deterioration in the peripheral European stock markets. Of the PIIGS,…
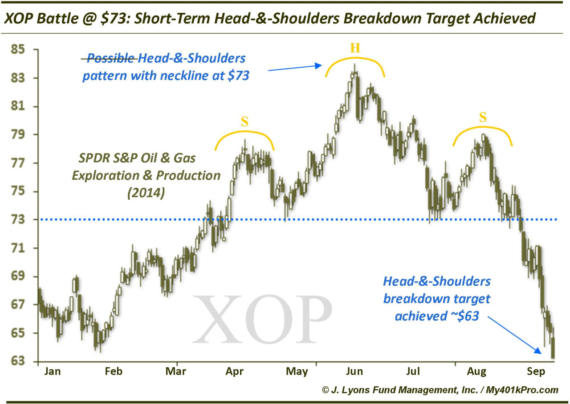
Oil $ Gas ETF Head-&-Shoulders Target Achieved In a September 15 post, we labeled the SPDR S&P Oil & Gas E&P ETF (XOP) the “most…
Back on July 2, we posted a Chart Of The Day which we ridiculously titled “The Most Significant Chart Event Of This Era?”. The subject…
My401kPro’s October update is in. Check out the Commentary, current Equity Allocation and your Fund Rankings: www.My401kPro.com.