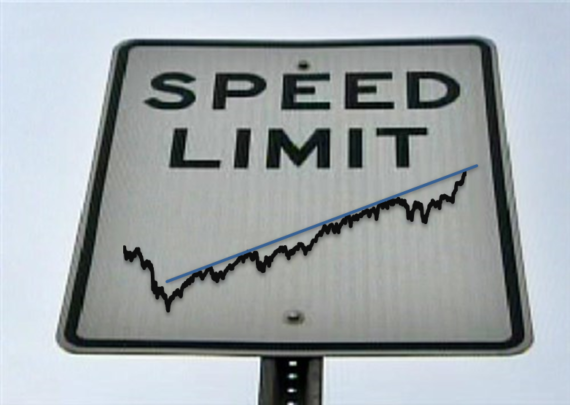
The Dow is presently hitting the upper bound of its post-2009 bull market. Given today’s Fed-juiced stock market rally, Wednesday’s Chart Of The Day seems…


The Dow is presently hitting the upper bound of its post-2009 bull market. Given today’s Fed-juiced stock market rally, Wednesday’s Chart Of The Day seems…

Despite the averages’ close proximity to 52-week highs, the number of NYSE New Lows has recently surpassed that of New Highs. Although the major stock…

The stock market burst higher on Wednesday from already elevated conditions; has it spent all of its fuel, or could there be more in the…

The number of unchanged issues on the NYSE has spiked, often a sign of complacency among investors. While the price structure and breadth in the…

The broad-based Value Line Geometric Composite is threatening to break out above a triple top spanning 3 decades. Back in December, amid the whole Dow…

Despite the major averages’ continued drift near all-time highs, volume moving into advancing stocks has been historically light. About a month ago, we noted some…

While the Dow Industrials remain near all-time highs, the Utilities are well off of their highs; this has signaled trouble in the past. …
While “all” eyes were on Dow 20,000, one broad market index actually registered a meaningful breakout. For the past 7 weeks, the investment world has…
This post originally appeared as the J.Lyons Fund Management, Inc. December 2016 Newsletter at jlfmi.com. As 2016 draws to a close, we again take a…
The S&P 500 has now tied a record with 9 consecutive days trading within the range set 10 days ago; what are the ramifications of…